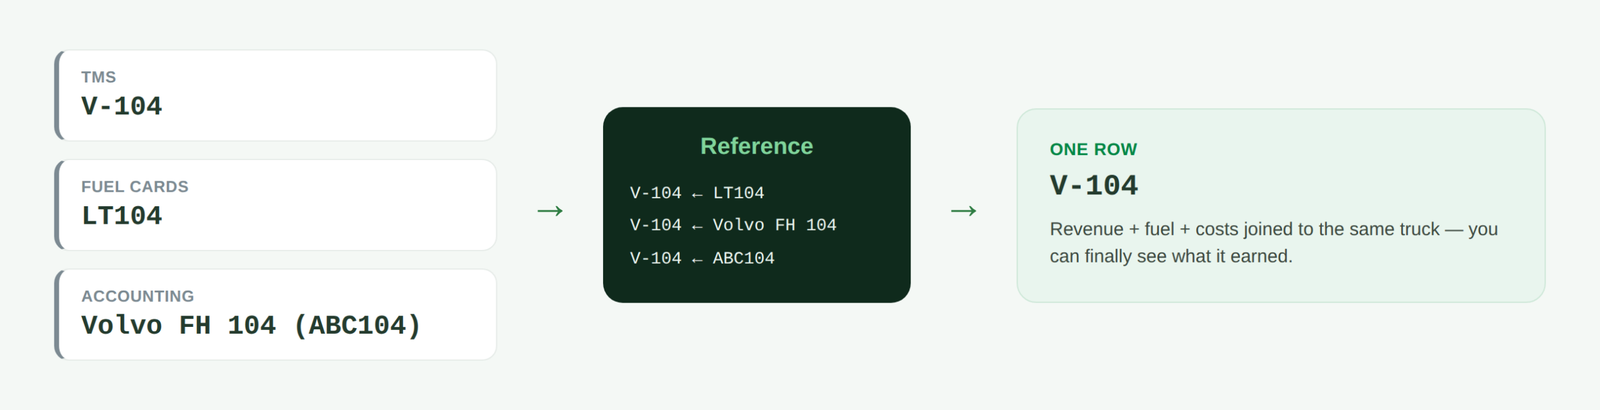
A carrier’s data about the same truck lives in three places. In the TMS it is V-104. On the fuel-card statement it is LT104. In accounting it is Volvo FH 104 (ABC104). The same truck, three different names.
Until you join them, you cannot answer the simplest question: how much did a specific truck earn or lose. Because its revenue, fuel and costs are stored under different “surnames”.
V-104 and LT104 are two completely different strings. The fix is one reference table (a map) through which all three systems find each other.
1. One reality, three names
Each system was built for its own purpose, so it writes the truck in its own way. The TMS uses an internal fleet code, the fuel-card provider its own numbering, accounting the make with a plate number. None of them is “wrong” – they were simply never aligned with each other.
To a human it is obvious it’s the same truck. To the data tables it is not, and that is exactly where the work begins.
2. Why the systems don’t join by themselves
A join always relies on an exact match. If one column says V-104 and another says LT104, to the program these are two unrelated strings – just like two different words. It has no way of knowing they are the same object.
So trying to “just merge” three files ends in empty cells or duplicate rows. Before joining, you have to create a common language.
3. The fix: one reference table
The common language is a small, hand-built table (a reference) that lists, for each truck, all of its names: the fleet code, the fuel-card number, the accounting object. It is created once and becomes the single point through which all systems find each other.
Technically this is a dimension table – the same principle any tidy data model rests on. Later, when the truck list changes, you fix only the reference table, not every report.
4. How to join – Merge Queries
The join is done with Merge Queries (Left Outer): fuel and cost data are joined to the reference table by the matching code, and then the common fleet code is expanded. After this step all three sources speak the same language – instead of three names, one remains.
Order matters: first clean the names themselves (strip spaces, unify the format), and only then join. Otherwise even a correct reference table will fail to join records that hide an invisible space or a different dash.
5. So new cost types pull in on their own
Costs often arrive in a “wide” format – each cost type in its own column. If you join such a table directly, a new cost type that appears (a ninth, say) quietly stays out.
So Unpivot Other Columns is used, not a fixed column list: that way any new type is pulled in automatically, with nothing to fix. In the demonstration report this turned 192 rows into 1,536 – and prepared the model for future changes.
6. A quiet check so nothing drops out
After joining, it’s worth leaving a small validation query that picks out records with no match in the reference table (where the code came back empty). Normally it is empty. But if a new truck that isn’t in the reference table ever appears, it lands right here – instead of hiding in the grand total and quietly corrupting the numbers.
It’s cheap insurance that later saves hours of hunting for why the numbers “don’t quite add up”.
Conclusion
The biggest barrier to joining a carrier’s data is not technology, but the fact that the systems name the same truck differently. One hand-built reference table, Merge Queries and Unpivot solve it for good – and turn three disconnected statements into one report that knows which truck earned what.
You can see how all of this looks in a finished report here: the fleet-margin report case study.
Is your data also spread across three systems?
Send me the files you get from your TMS, fuel cards and accounting – I’ll assess for free how to join them into one model and what you’d see from it.
Get a free assessmentPower Query cheat sheet: automate your report
The key steps, the 5 common mistakes, and when automating is worth it.
- PDF · 2 pages, practical
- No spam — value only