
In this article I’ll show how to automate an Excel report using Power Query — with a real example using CSV files and the Folder method. Recurring Excel reports often look harmless: you download a file, fix a few columns, refresh the calculations, review the charts and save the result.
But if you repeat the same process every week or month, it’s no longer a one-off task. It’s a process worth automating.
The example uses CSV exports from the grid operator’s (ESO) self-service portal, containing solar plant production data.
What problem does this solve?
If you own a solar plant, you can download production data from the grid operator’s (ESO) self-service portal. It shows how much electricity was produced, how much was consumed, how much was fed into the grid and other related figures.
The data can be downloaded at different levels of detail: hourly, daily or monthly. That’s convenient, but the manual work begins when these exports have to be turned into a clear report.
A typical manual process might look like this:
- CSV files are downloaded from the ESO portal;
- the files are opened in Excel;
- date and number formats are fixed;
- unnecessary columns are removed;
- KPIs are calculated;
- charts and the dashboard are updated.
If you do this once, it’s no big deal. But if data comes in regularly, this quickly turns into repetitive manual work.
What does the end result look like?
The goal of automation isn’t just to tidy up the data. The goal is a clear result that helps you understand the situation at a glance.
In this project the end result is an Excel dashboard showing the key solar production figures, trends and comparisons.
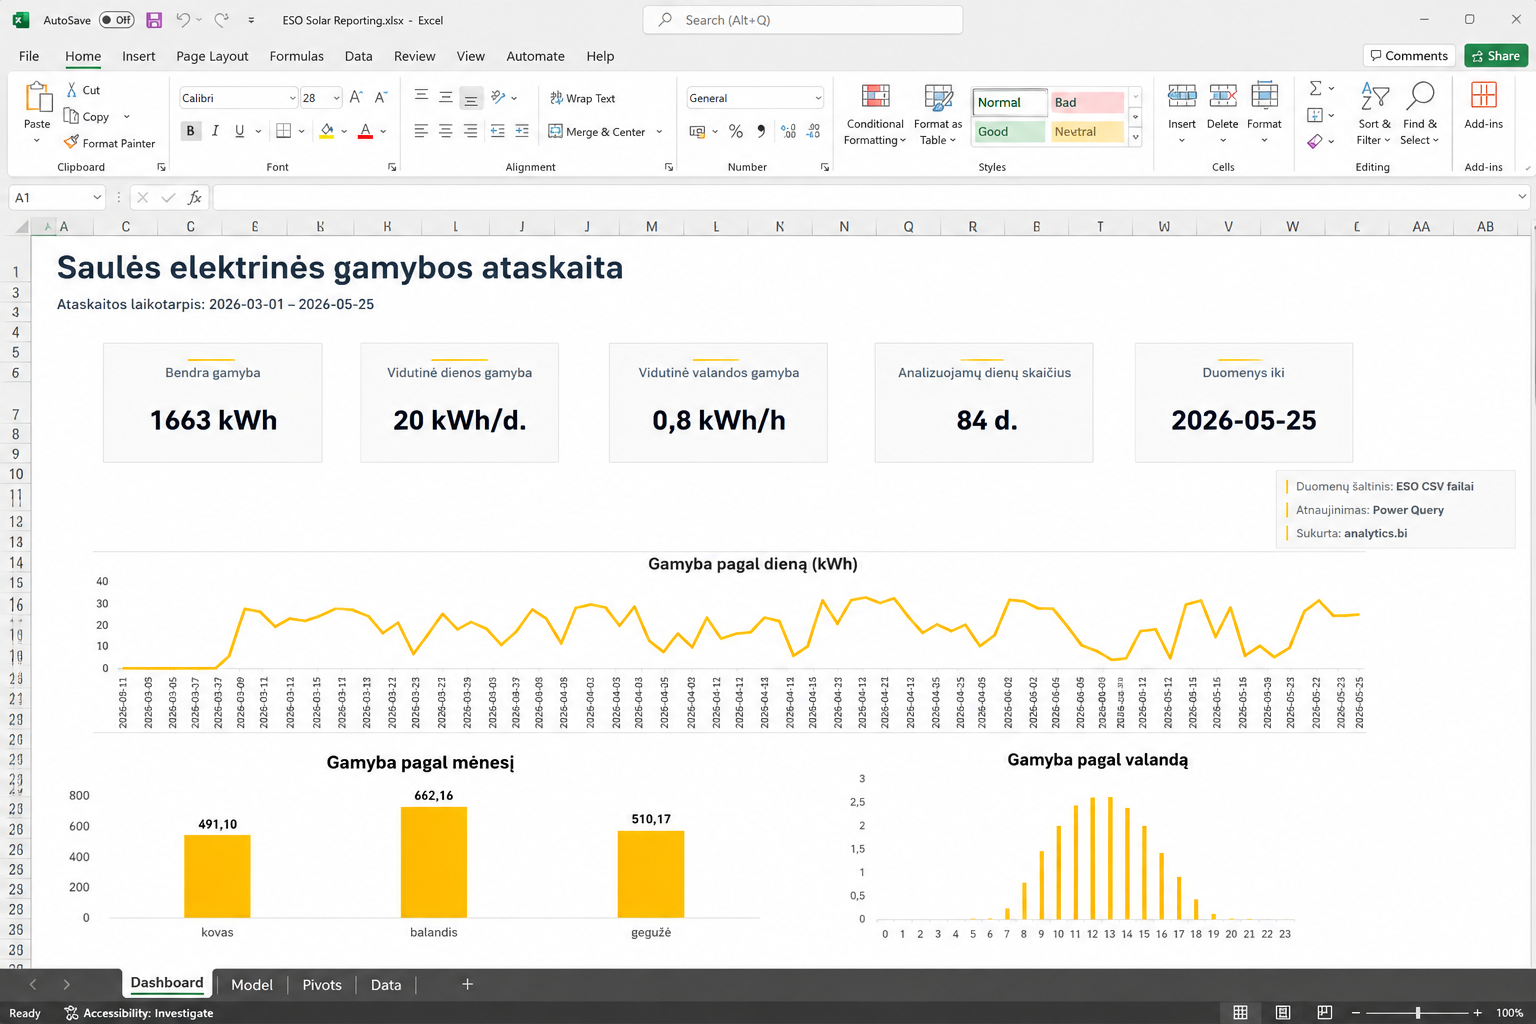
Such a dashboard means you no longer dig through individual CSV files, but see the summarized picture right away.
What data source is used?
The data source in this example is the ESO self-service portal. CSV files with solar plant production data are downloaded from it.
Instead of importing each file separately, all files are kept in one folder. It’s this folder that Power Query connects to.
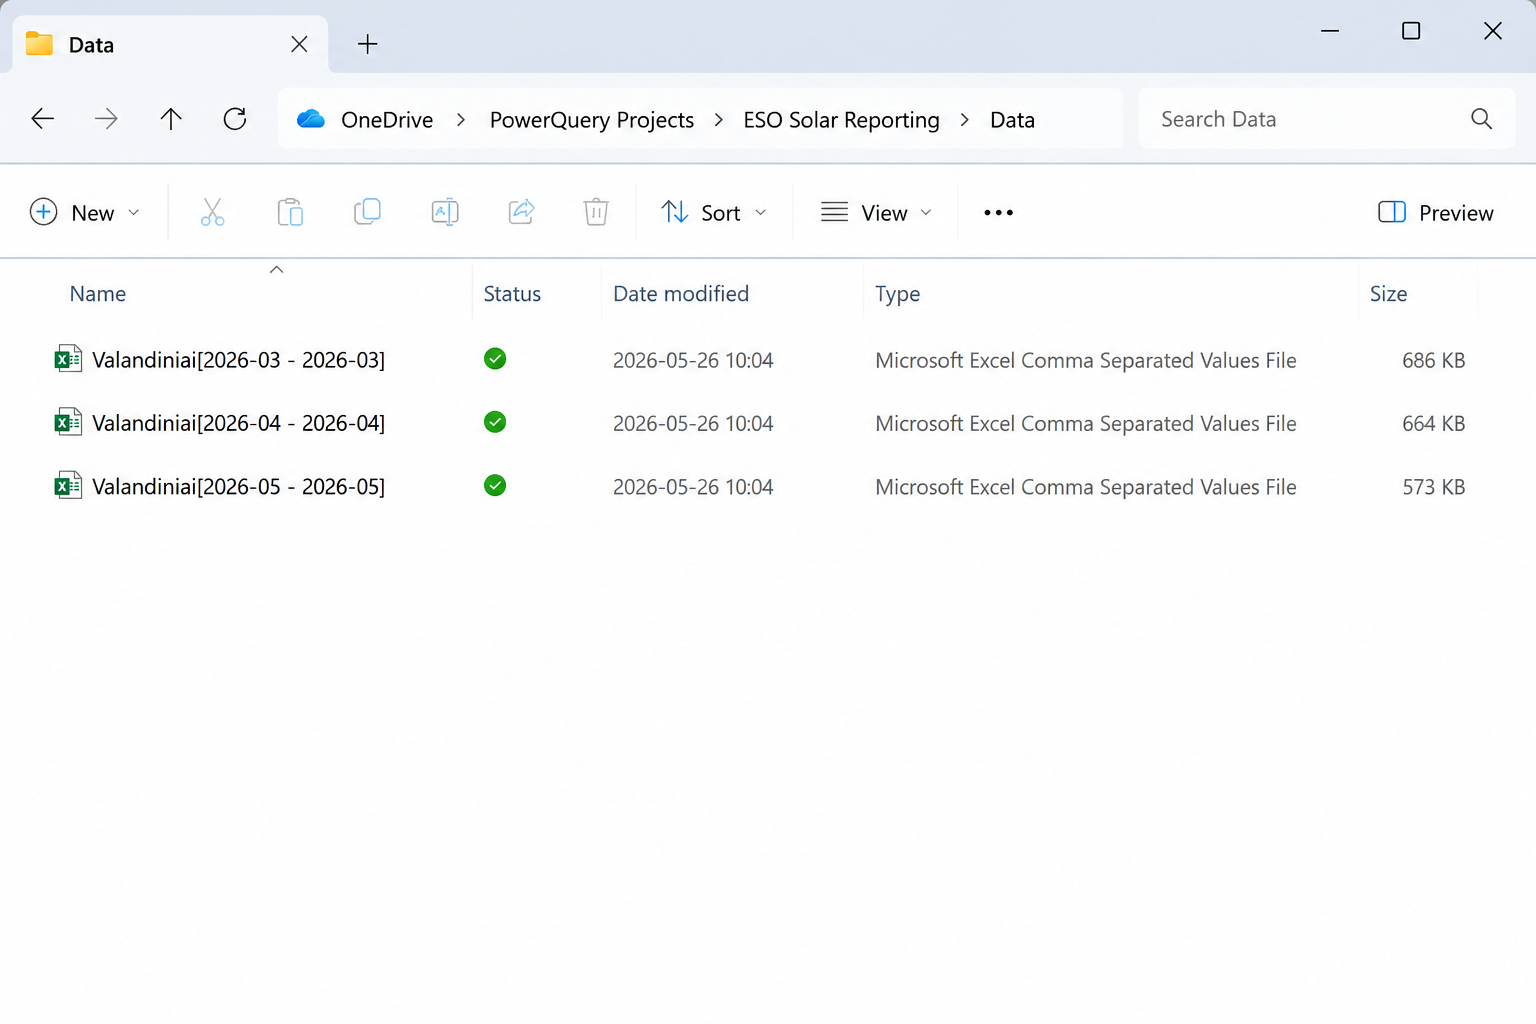
This method is especially useful when new files share the same structure and are added regularly in the same format.
Why the Folder method?
Power Query can be connected to a single specific file. But that isn’t always the best choice.
If a new CSV file appears every month, it’s more convenient to connect to the whole folder. Then you only need to drop the new month’s file into the same folder.
The Folder method has several important advantages:
- no need to build a new query every time;
- no need to merge files manually;
- new files are automatically included in the combined dataset;
- the process becomes clearer and easier to maintain.
This is one of the most common Report Automation principles when working with recurring Excel or CSV exports.
How does Power Query prepare the data?
When Power Query connects to the folder, it combines the files and lets you define the transformations once. The same rules are then applied to new files too.
In this project Power Query is used for a few key steps:
- import CSV files from the folder;
- standardize the column structure;
- fix date formats;
- fix number formats;
- remove unnecessary columns;
- prepare the data for KPI calculations and the dashboard.
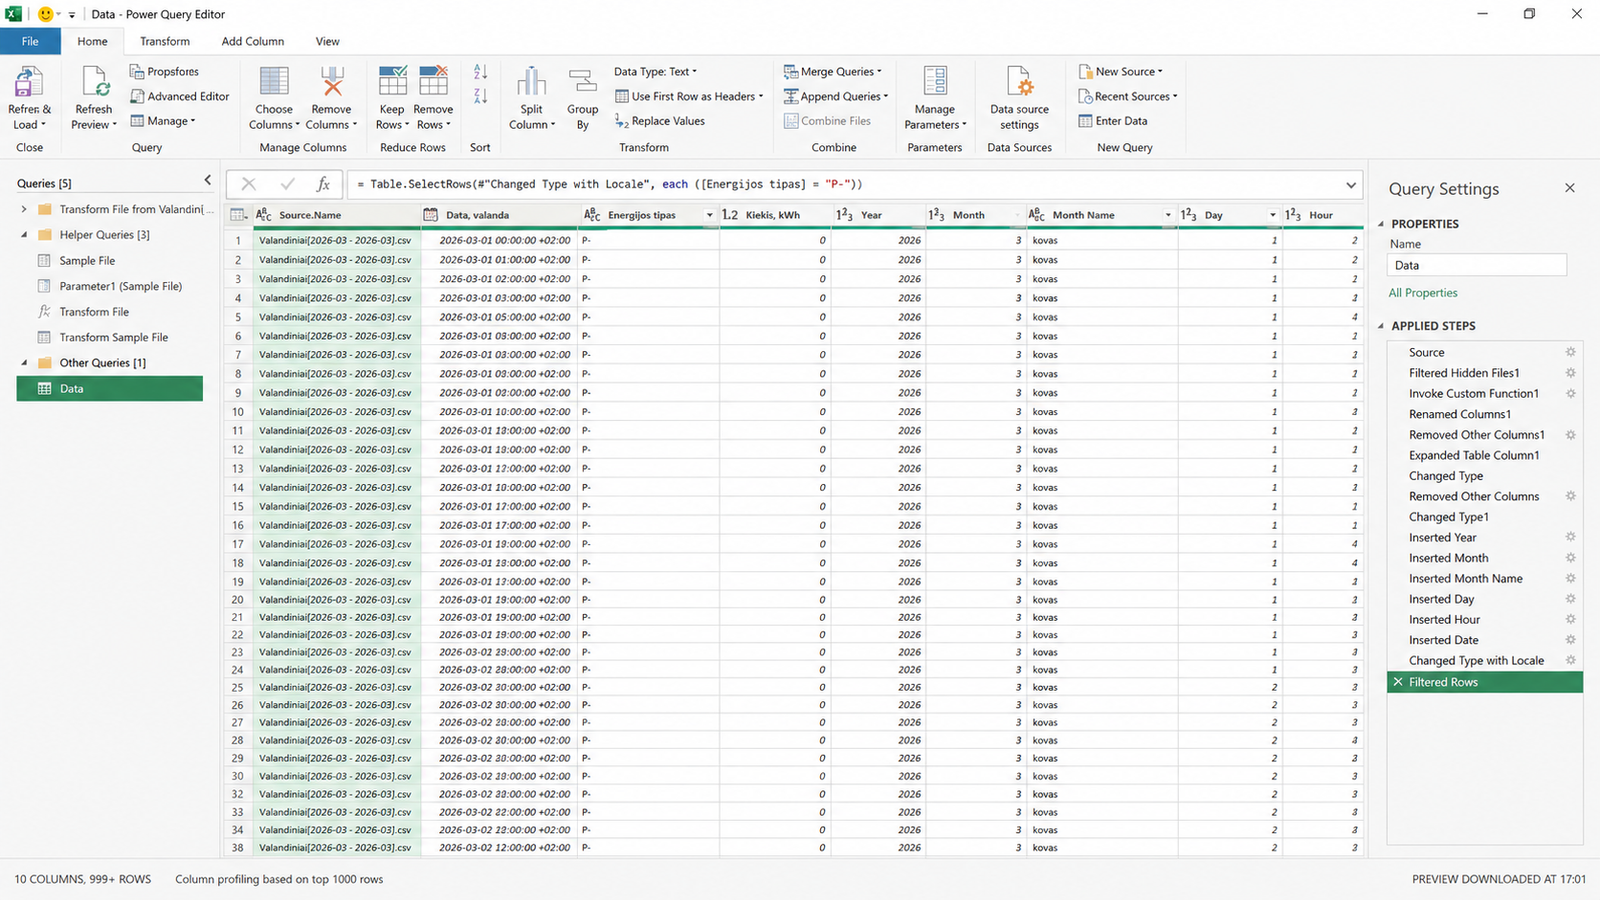
The key point is that these steps no longer need to be repeated by hand. When a new CSV file appears, Power Query applies the same transformations to it.
How does the Excel dashboard refresh?
Once the data is cleaned in Power Query, it’s passed to the Excel report. KPIs are then calculated from it and the charts are updated.
For the user, the process looks simple:
- a new CSV file is downloaded from the ESO portal;
- the file is dropped into the same Data folder;
- in the Excel file you press Refresh;
- the dashboard refreshes automatically.
This is the core Report Automation principle: the technical logic is built once, and afterwards only a few simple steps are left for the user.
What no longer needs to be done manually?
Once such a process is automated, you no longer have to repeat the same actions every time.
For example, you no longer need to:
- merge CSV files manually;
- copy data between sheets;
- fix formats every time;
- rebuild the charts;
- recalculate KPIs by hand;
- check whether all new files made it into the report.
Fewer manual steps mean not only faster work, but also a lower chance of errors.
When is this approach worth using?
The Folder method is especially suitable when you regularly receive files with the same structure.
For example:
- sales exports every month;
- CSV files from an accounting system;
- production metric exports;
- time-tracking files;
- electricity generation or consumption data;
- other recurring Excel or CSV reports.
As long as the file structure stays stable, Power Query can become a very reliable automation tool.
Why does this example matter for Report Automation?
This example shows clearly that Report Automation isn’t just a single Excel feature. It’s a whole process, from getting the data to the final report.
A few elements matter here:
- a clear file structure;
- a consistent format across data sources;
- Power Query transformations;
- automated Refresh;
- a final dashboard that’s easy to use.
This approach lets you build not one-off Excel files, but real automated reporting processes.
Frequently asked questions
Does the Folder method only work with CSV files?
No. Power Query can connect to a folder with Excel, CSV and other supported file formats. The main thing is that the file structure is reasonably stable.
What happens if I add a new file to the folder?
If the file has the same structure, Power Query will include it in the combined dataset after Refresh.
Can I rename the files?
Usually yes, as long as the Power Query logic is based on the folder rather than a specific file name. That’s one of the advantages of the Folder method.
Can this approach be applied to company reports?
Yes. The same logic can be applied to automating sales, finance, production, project or other recurring reports.
Conclusion
Power Query lets you automate the preparation of recurring Excel reports, especially when you regularly receive files with the same structure.
In this example, CSV files from the ESO portal are dropped into a folder, Power Query combines and cleans them, and the Excel dashboard refreshes at the click of Refresh.
It’s a simple but very practical Report Automation example: data goes into one place, and the report updates automatically.
Want to automate a recurring Excel report?
If you handle similar Excel or CSV files every week or month, chances are at least part of the process can be automated.
I can review your reporting process and suggest how to simplify it using Excel, Power Query or Power BI.
Assess automation optionsPower Query cheat sheet: automate your report
The key steps, the 5 common mistakes, and when automating is worth it.
- PDF · 2 pages, practical
- No spam — value only