
Monthly solar power reports are a good example of how repetitive work quietly eats up time. Every month, CSV files with generation data are downloaded from the ESO self-service portal, and they need to be combined, cleaned, recalculated and pushed into a dashboard.
In this example I’ll show how the same process went from half a day of manual work to a single click of Refresh. (Demo data is used – no real client information is shown.)
1. The situation: how the process looked before
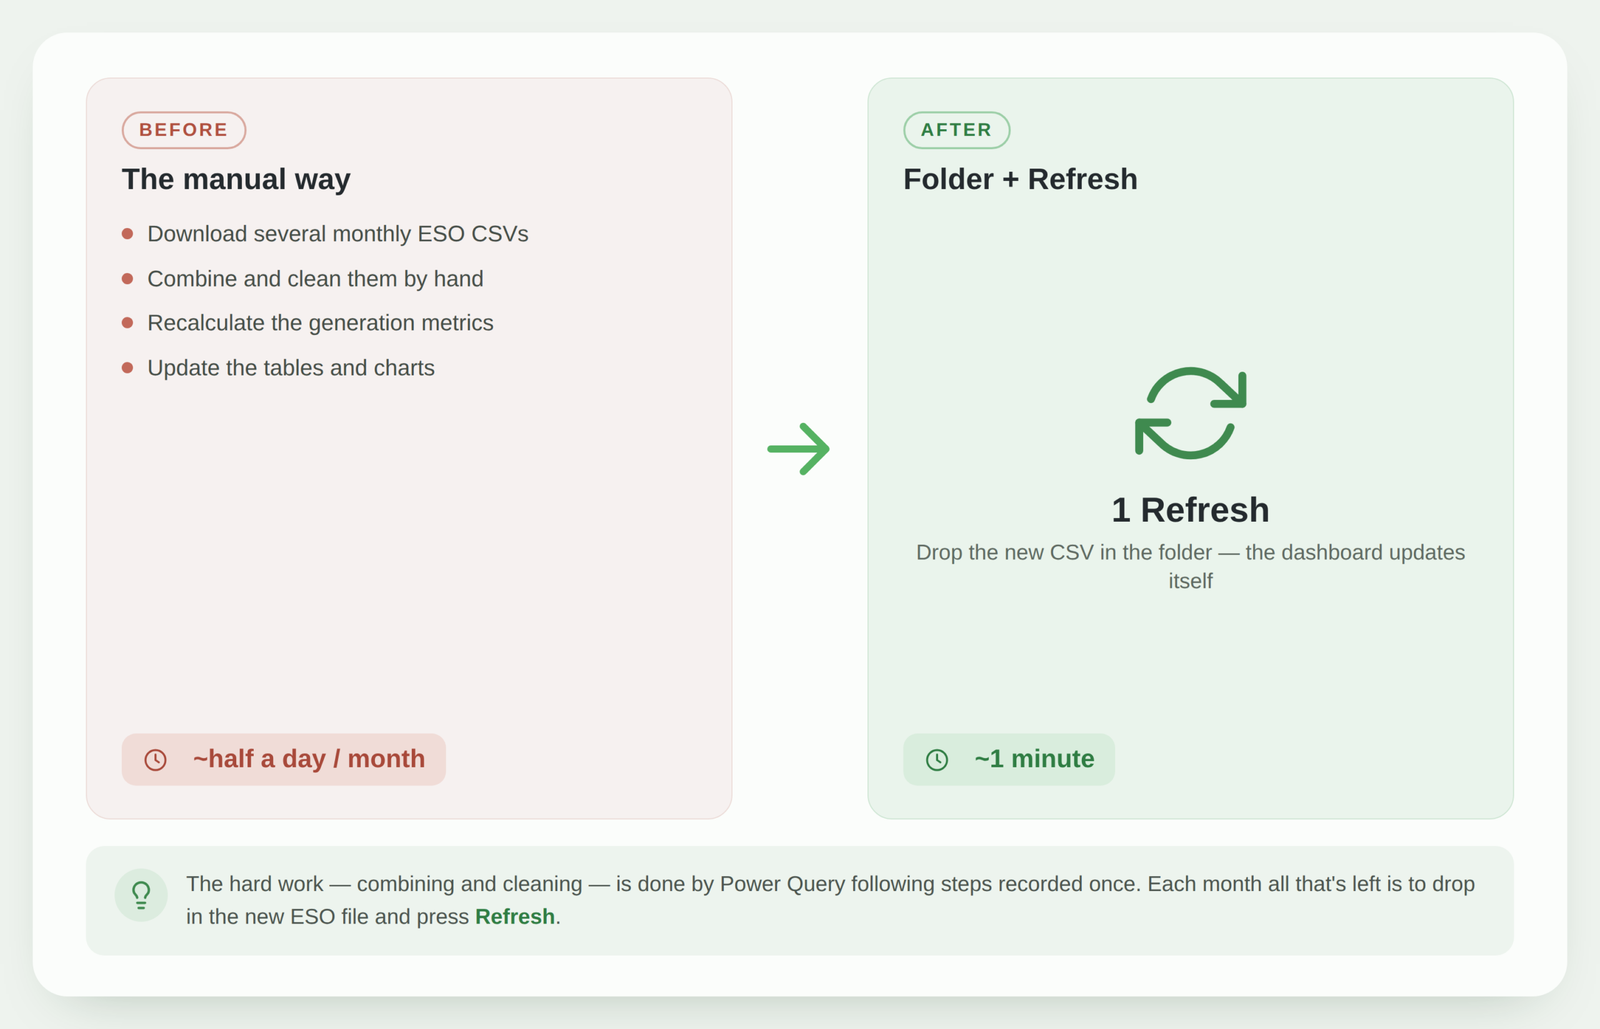
At the start of every month, the same thing repeated: download several ESO CSV files, open them, combine them into one table, remove unnecessary columns, fix the dates, and only then calculate the generation metrics and update the charts.
The problem isn’t that it’s complex – it’s that it repeats. The same actions every month, the same half a day, and the same risk of slipping somewhere while copying.
2. The goal: what was needed
The goal was simple: a report that updates without manual work. So that the new month’s data lands in the dashboard without copying, without fixing dates and without „redoing it all again”.
It also mattered that the solution stayed in Excel – without new tools that would need to be learned separately.
3. The solution: how it was done
Instead of manual copying, the data started coming in through Power Query. Instead of connecting to a single file, Power Query was connected to a whole folder (Folder import): all ESO CSVs from the same folder are automatically combined into one table.
The query then records all the cleaning steps once – handling dates, removing unnecessary columns, assigning types. The cleaned data feeds an Excel dashboard with generation metrics and charts.
The concrete steps for building such a process are described separately: how to automate an Excel report using Power Query.
4. The result: what changed
The change is fundamental: the new month’s file just needs to be dropped into the folder and Refresh pressed. Power Query includes it automatically, applies the same steps and updates the whole dashboard.
Half a day of manual work turned into an action of about one minute – and, just as importantly, the risk of copy-paste errors disappeared.
5. What you can take away for yourself
Even if your data has nothing to do with solar plants, the principles are the same:
- if you receive files with the same structure every month, connect to a folder, not a single file;
- record the cleaning steps once in Power Query instead of repeating them by hand;
- separate the raw data from the dashboard, so a new file breaks nothing.
This works with sales, accounting, production or any regular exports.
Conclusion
This example isn’t about „complex automation” – it’s about the fact that repetitive work can be recorded once and no longer done by hand. The result is a report that refreshes at the click of a button, and half a day reclaimed every month.
Have a similar monthly report?
If you handle similar CSV or Excel files by hand every month, I can build the same process for your report – so it updates at the click of Refresh. In a free consultation I’ll tell you whether your report is worth automating and how long it would take.
Assess automation optionsPower Query cheat sheet: automate your report
The key steps, the 5 common mistakes, and when automating is worth it.
- PDF · 2 pages, practical
- No spam — value only