The end of every month looks the same. You open a few files, copy, paste, drag formulas down, check that nothing „slipped”, and a couple of hours (sometimes days) later you have a report that next month you’ll have to build almost from scratch again.
Usually the problem isn’t that you don’t know Excel. The problem is that the report eats your time and creates anxiety: „did I make a mistake somewhere while copying?” This is exactly where report automation stops being „something complicated for IT people” and becomes a simple everyday tool.
1. Every month you repeat the same steps by hand
You open the same files, delete the same empty rows, rename the same columns, join the same tables. The same route, just with new data.
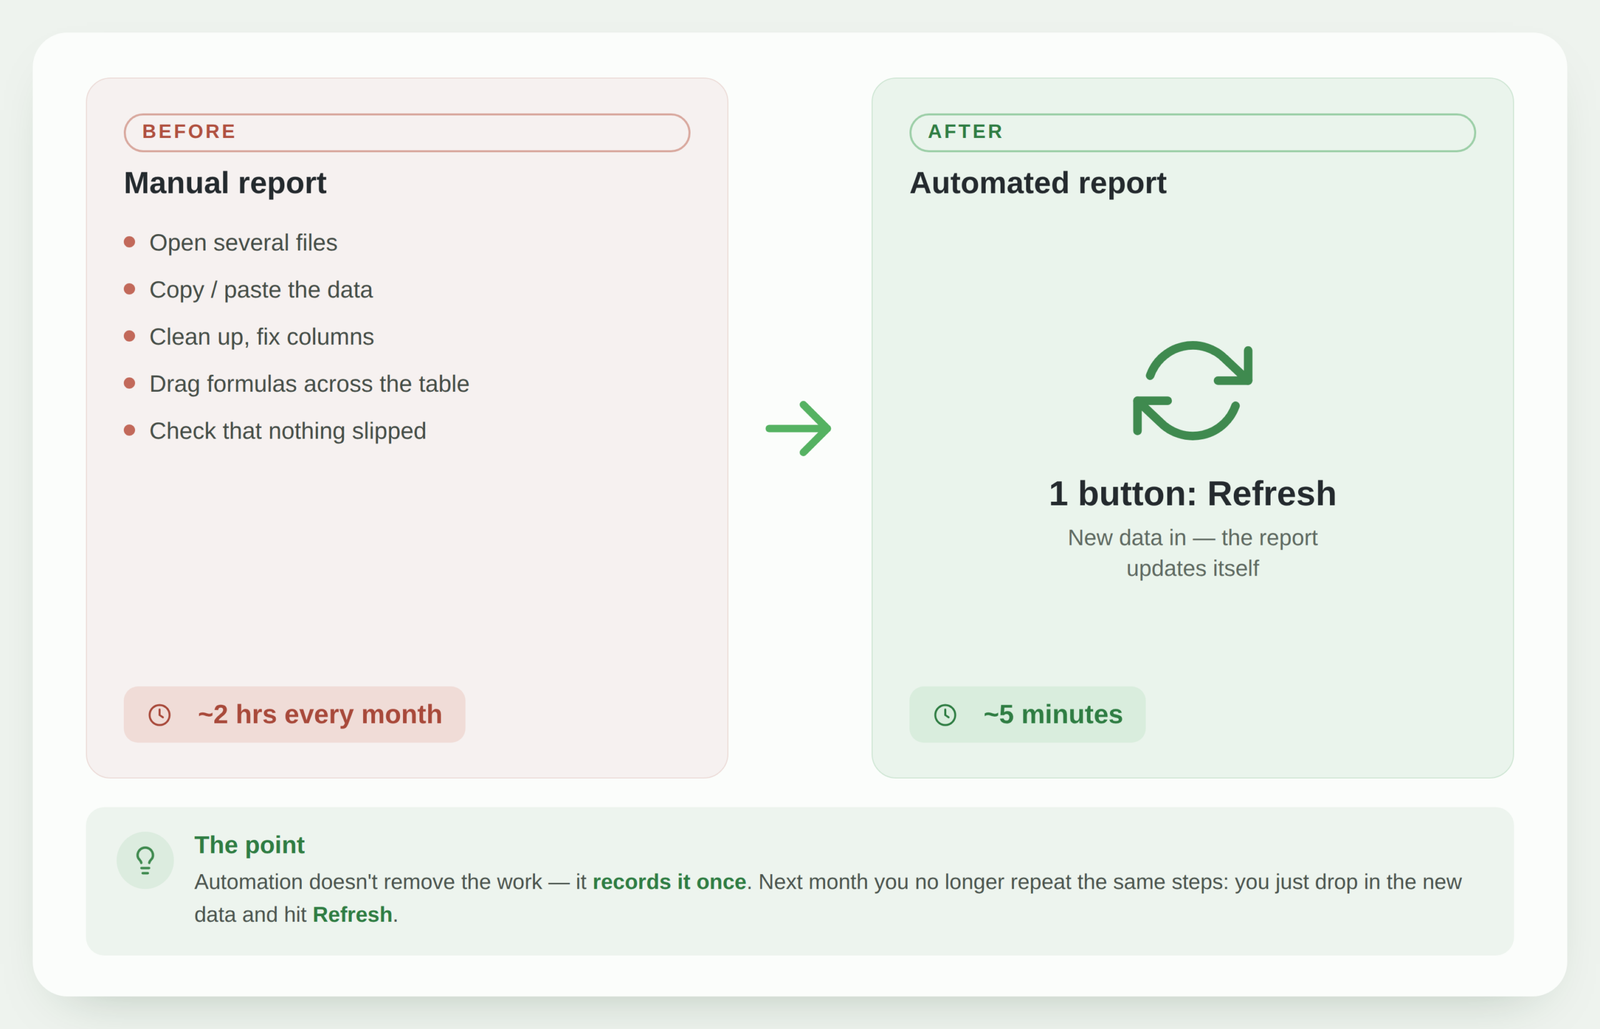
If you can describe your actions as „step by step, always the same”, it’s no longer your job – it’s a machine’s job. That’s exactly what Power Query is for: you record those steps once, and next month you press Refresh, and everything happens in a few seconds.
2. The report „breaks” when the source changes slightly
Someone added a new column. Renamed a heading. Sent a file with an extra month or a different column order. And suddenly your formulas show #REF! and the totals no longer add up.
A manually built report is fragile – it holds up only as long as everything arrives exactly as it did the first time. In an automated report the steps rely on column names and logic, not on a specific cell location, so it withstands the usual source changes. The file changed – you still just press Refresh.
3. You’re afraid to change anything, because „you’ll have to redo it all again”
This sign is perhaps the most important, because it’s about a feeling, not about technique. The report is so intricate and so fragile that you don’t even think about improving it: „it works – don’t touch it.” Every change means hours of work, so it’s better to change nothing.
This is a sign of fear and inertia, and it’s expensive: the report stops improving, and you become its hostage. When the steps are recorded automatically, changing becomes safe – you adjust one step, press Refresh and see the result immediately. There’s nothing left to fear, because there’s nothing to „redo from scratch.”
4. You merge data from several files or sources by hand
One file from accounting, another from the warehouse, a third an export from a system. You glue them together, then drag XLOOKUP or VLOOKUP across the whole table to pull in prices, names or categories.
The more sources, the more places to make a mistake and the longer everything takes. Power Query can combine several files, or even a whole folder, into one table and „attach” additional data (Merge) automatically – you set up the relationship once, and after that it runs itself every month. Instead of dozens of copy-pastes – a single Refresh.
5. You can’t quickly answer „so what are the numbers?”
A manager asks for the numbers, and you reply: „it’ll take a few hours to refresh the report.” If refreshing the report takes so long that it becomes an obstacle to answering a simple question, that’s a clear sign the process is too slow for the business.
An automated report turns the answer to „what are the latest numbers?” from „give me a day” into „here, I just pressed Refresh”. From being the person who produces the report, you become the person who reads it and makes decisions. That’s exactly what you’re paid for.
What to do next?
If you recognized at least two signs, here’s the good news: you don’t need to become a programmer and you don’t need to take long courses. Most of these problems are solved by one part of Excel – Power Query – which is already in your Excel, most people just never open it. I’ve described the exact steps separately: how to automate an Excel report using Power Query.
If you want to see what this looks like with a real report, here’s one project example where several hours of manual work turned into a few minutes.
The main thing is to start with the one report that bothers you most and turn it from „2 days of manual work” into „a 5-minute Refresh”.
Conclusion
None of these signs is a catastrophe on its own. But if you recognize two or more, your report is already telling you what it needs: less manual work and more reliability. Automation here isn’t about „complicated tools” – it’s about no longer doing the same work from scratch every month.
Want me to automate the report for you?
If you recognized a couple of the signs but don’t want to spend time learning, I can review your reporting process and suggest how to simplify it using Excel, Power Query or Power BI.
Assess automation optionsPower Query cheat sheet: automate your report
The key steps, the 5 common mistakes, and when automating is worth it.
- PDF · 2 pages, practical
- No spam — value only