
Power Query is most often used to prepare data before analysis. If you’re not yet sure what it is – start with:what Power Query is and why it matters.
When to use Group By
Use Group By when you need to create a summary:
- sales by region
- number of orders by customer
- average by category
This lets you reduce the amount of data and move to a level suitable for analysis.
A simple example
Suppose we have a sales table with region, product and amount. Using Group By we can turn it into a summary by region.
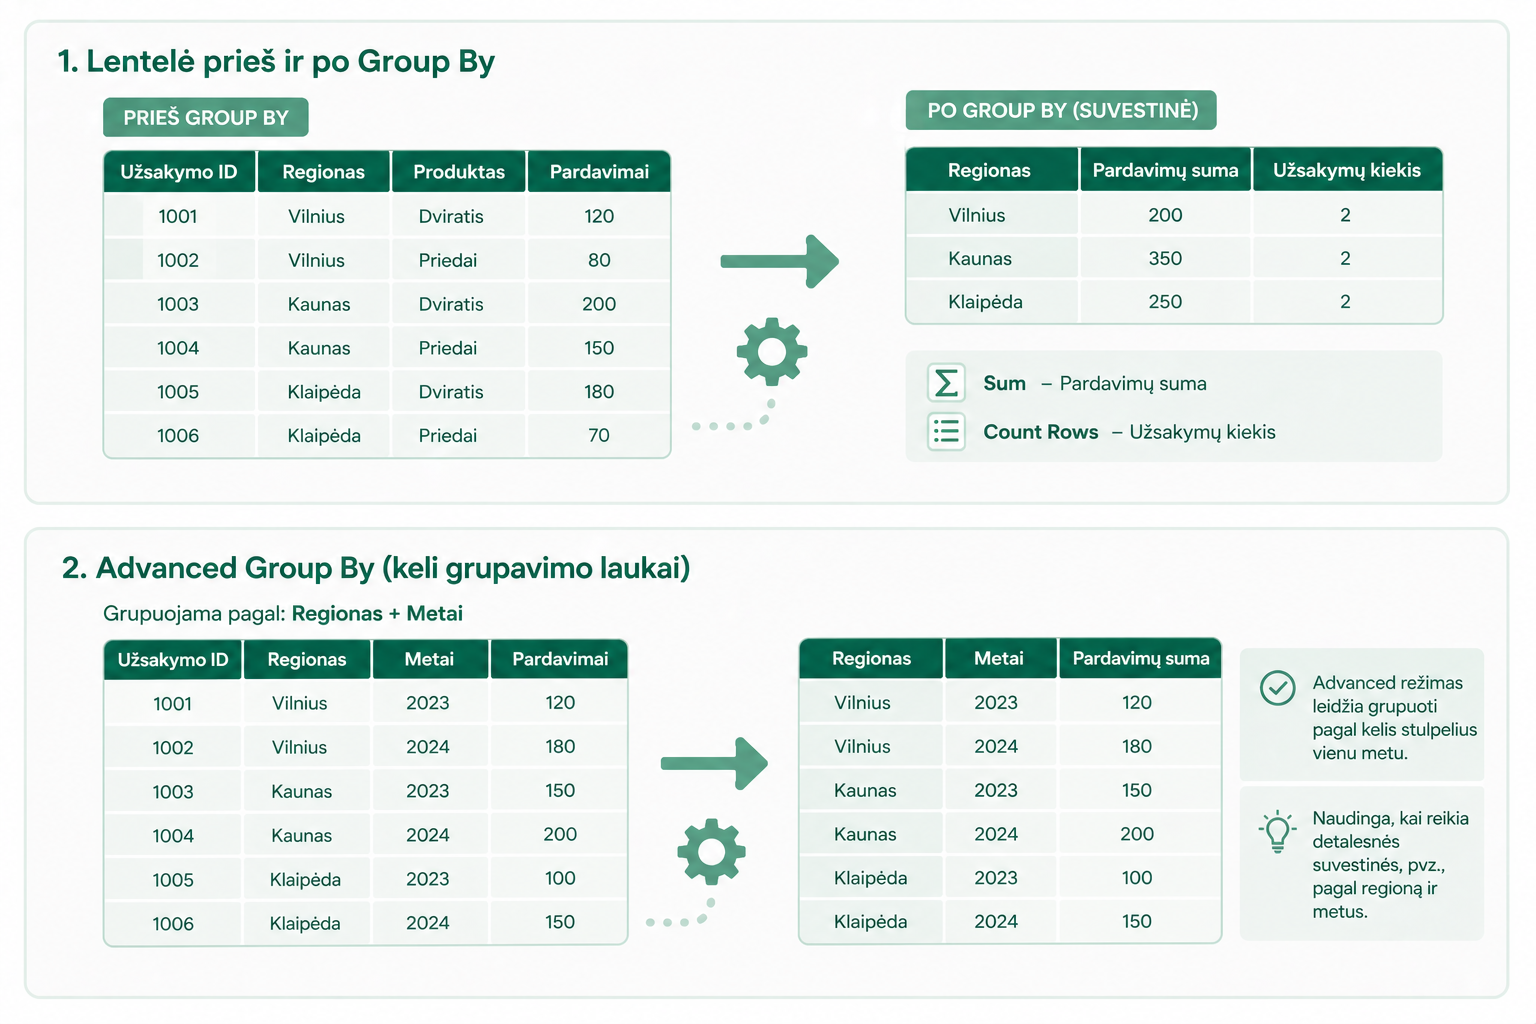
As a result, we get a smaller table with aggregated data.
The most common aggregation functions
- Sum– the total
- Count Rows– the number of rows
- Average– the average
- Min / Max– the smallest / largest value
Group By lets you aggregate data by one or more columns using these functions.
Group By with multiple metrics
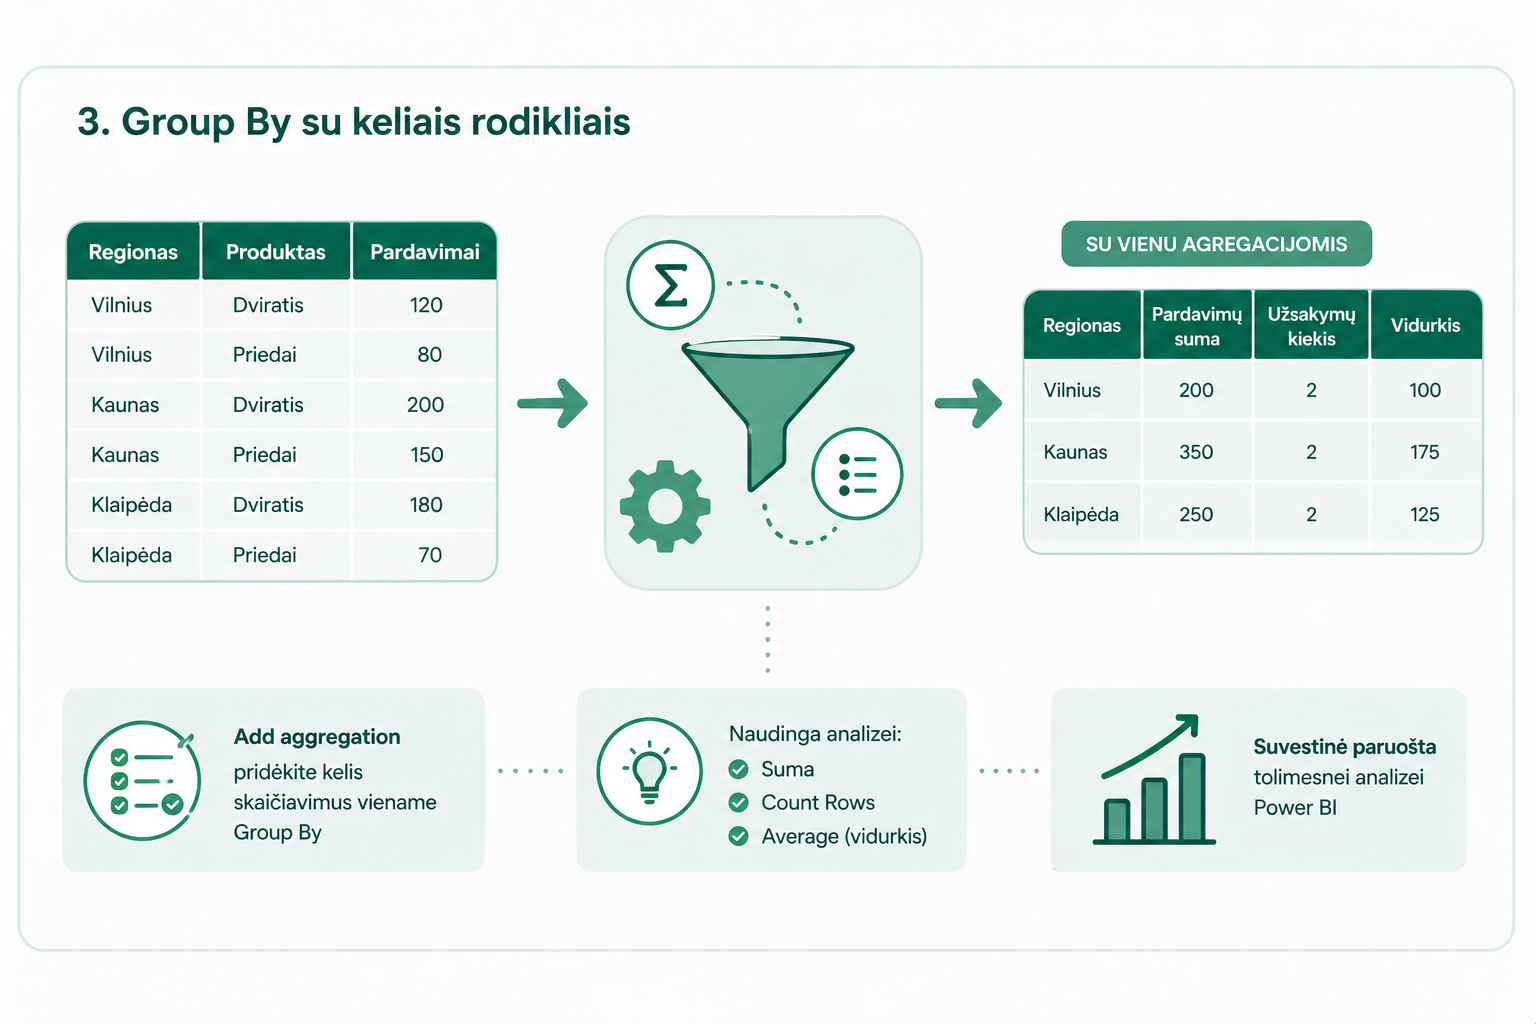
In a single Group By you can add several calculations – this is done with “Add aggregation”.
Advanced Group By (multiple grouping fields)
If you need to group by several fields (e.g. Region + Year), use Advanced mode.
This lets you create more detailed summaries and analyze data from different angles.
If you work with several tables, it’s worth understanding also:how Merge and Append differ.
Common mistakes
- data types are set incorrectly (text instead of numbers)
- you expect to keep the original rows
- Group By is used too early (the data isn’t cleaned up yet)
Before grouping, it’s important to:prepare a proper dataset.
Problems also often arise due to:incorrect data types in Power Query.
What to read next
Conclusion
Group By is one of the most important Power Query tools. It lets you transform data from “raw” to an analysis level.
Once you understand Group By, it becomes much easier to build Power BI reports and analyze data efficiently.
Power Query cheat sheet: automate your report
The key steps, the 5 common mistakes, and when automating is worth it.
- PDF · 2 pages, practical
- No spam — value only