Etsy sellers get a lot of data – but usually as a CSV export, not a clear picture. How much did I earn this month? Which products sell best? Which markets do the orders come from? Answering these means processing the same CSV by hand every time.
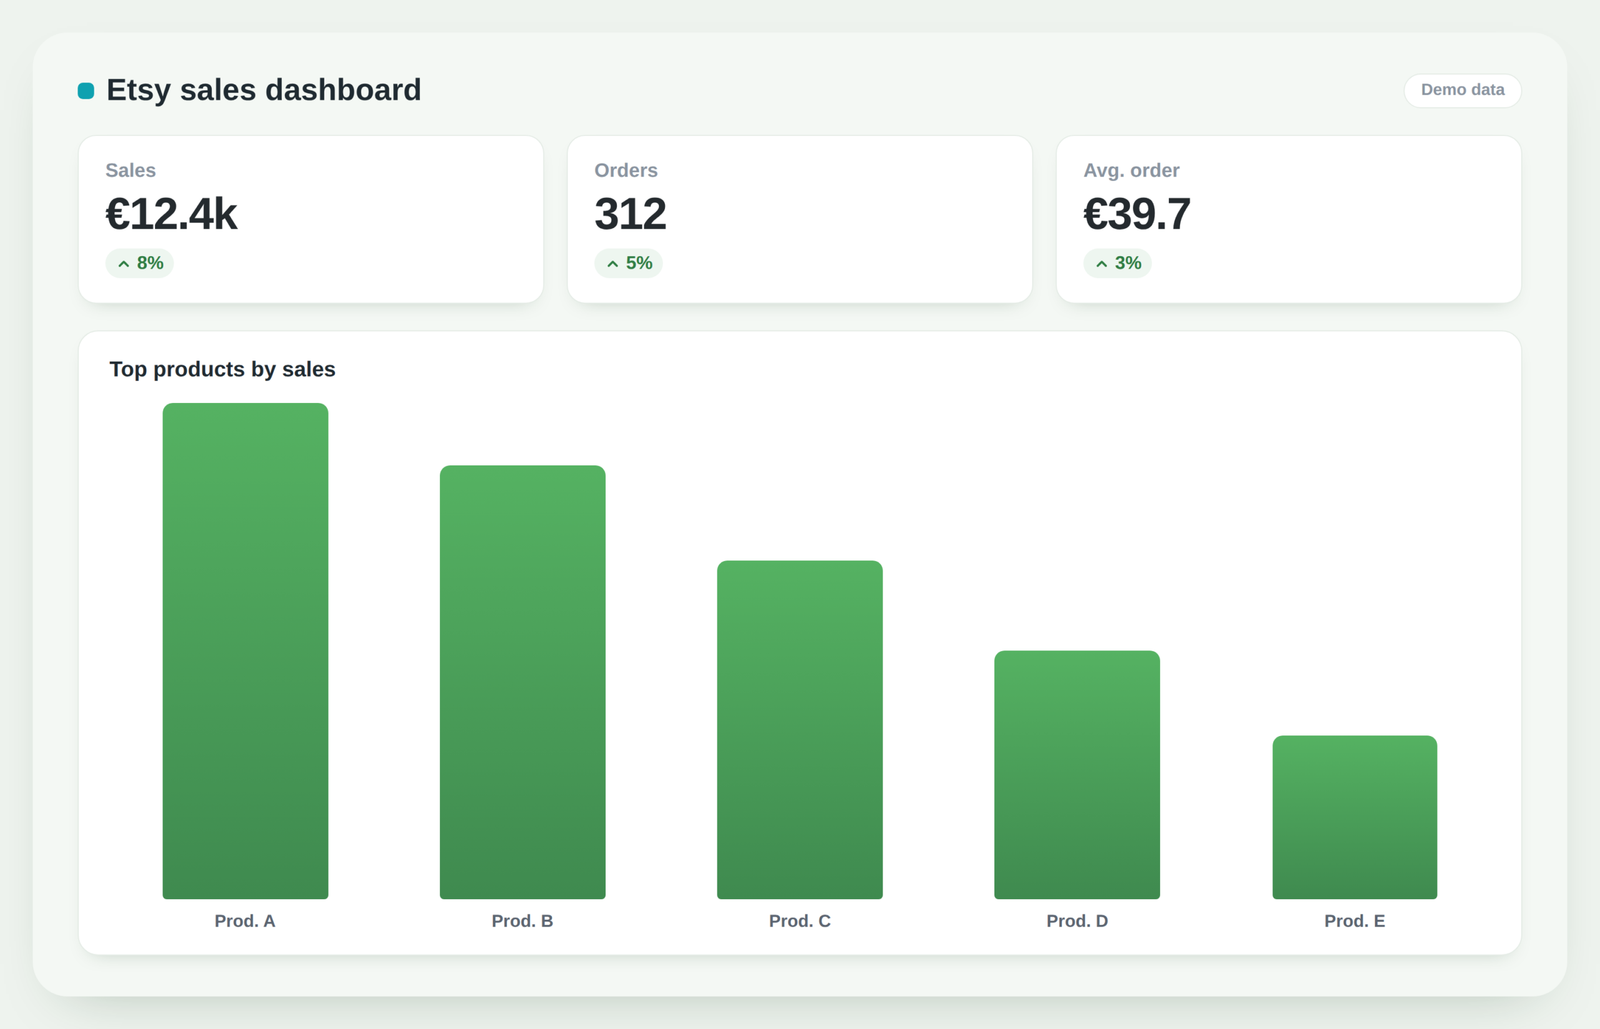
In this example I’ll show how an Etsy sales CSV became a live dashboard that updates with a single click of Refresh. (Demo data is used – no real client information is shown.)
1. The situation: there’s a CSV, but no picture
Etsy lets you download a sales CSV, but that’s just a list of rows. To understand how things are going, you have to open the file every time, add up totals, sort products and try to spot trends.
The same manual work each time – and still no clear, continuously updating picture.
2. The goal: what was needed
What was needed was a live dashboard that immediately shows the key metrics: sales, orders, average order value, top products and markets. And so that a new period’s CSV just needs to be loaded, instead of recalculating everything.
3. The solution: CSV → Power Query → dashboard
The Etsy CSV export is connected through Power Query, which records all the steps once: it cleans the data, fixes dates, calculates the KPIs and groups products and markets.
On top of the cleaned data sits an Excel dashboard with KPI cards and charts. A new CSV → one Refresh → the whole dashboard updates.
4. The result: what changed
Instead of a pile of CSV rows, there’s now a clear picture: sales, orders, average order value, top products and which markets the orders come from – all visible at once.
A new month’s data no longer needs calculations – you just load the new CSV and press Refresh.
5. What you can take away for yourself
This principle works far beyond Etsy – any platform’s export can become a live dashboard:
- Etsy, Amazon, Shopify or any CSV can be connected through Power Query;
- you record the cleaning and KPI calculation once, then just load the new file;
- KPI cards and „top product” lists are a fast way to understand how you’re really doing.
Conclusion
A sales CSV doesn’t have to stay a silent file. Connected through Power Query, it turns into a live dashboard that updates with a single click and instantly shows how you’re doing. Instead of calculating every time – a single Refresh.
Selling online and handling CSVs by hand?
I can turn your sales export into a live dashboard with KPIs and top products – so you can see how you’re doing at a glance. In a free consultation I’ll assess what can be done with your data.
Assess automation optionsPower Query cheat sheet: automate your report
The key steps, the 5 common mistakes, and when automating is worth it.
- PDF · 2 pages, practical
- No spam — value only