
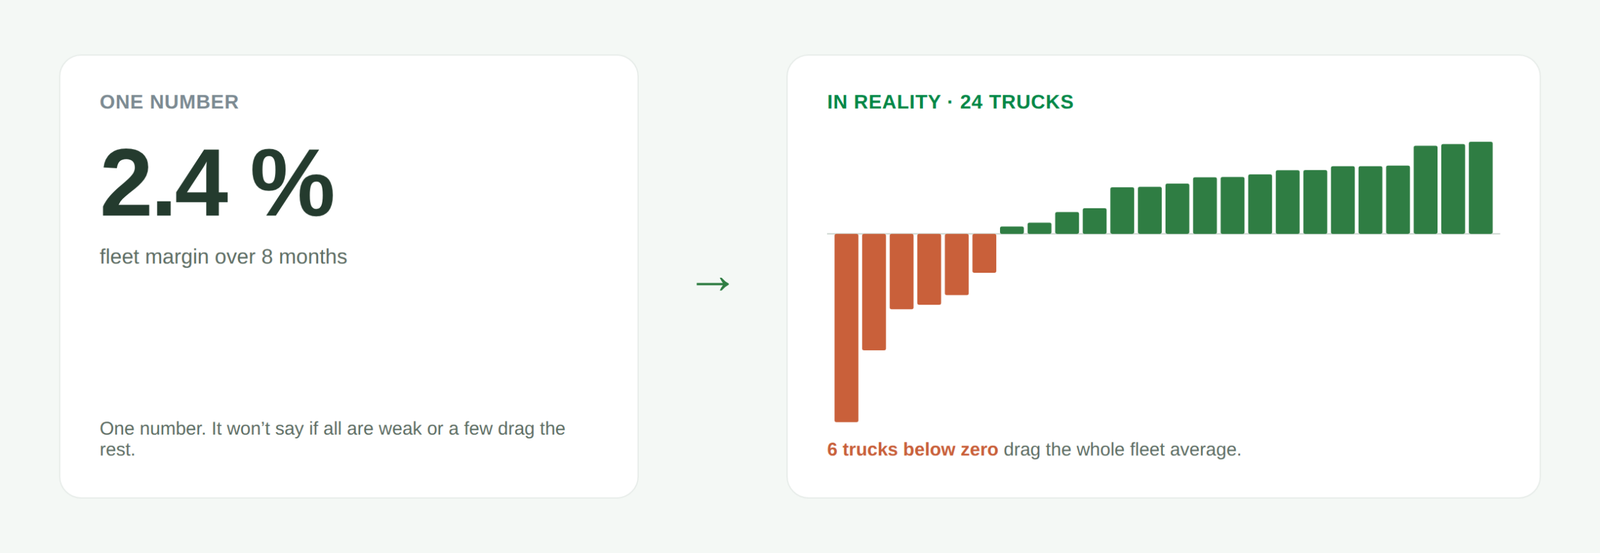
A carrier running 24 trucks opens the report and sees one number: fleet margin – 2.4 %. The number is correct. But it says almost nothing about what is actually happening in the fleet.
An overall margin is an average. And an average can mean two completely opposite things – and until you break it apart, you don’t know which one you’re looking at.
1. One number, two realities
Imagine two fleets, both with an overall margin of exactly 2.4 %. In the first, all 24 trucks perform about equally modestly. In the second, eighteen trucks earn decently while six run deeply at a loss and eat what the others make.
The overall figure is identical in both cases. But these are two completely different businesses: the first needs its pricing reviewed across the board, the second needs those six found and understood. As long as you look only at the overall number, you cannot tell which situation you are in.
2. Why the average hides the important part
An average, by its nature, compresses the spread into a single point. And that spread – whatever deviates most from the middle – is usually exactly where the problem or the opportunity lives.
When a manager sees only “2.4 %”, there is nothing to judge whether this is a uniform state or a few outliers. So the decision gets made on a hunch – and a hunch usually leans toward what is easiest to see (often the drivers), not toward what actually costs the most.
3. What breaking it down to the truck reveals
When you break that same 2.4 % down to the individual truck, the picture changes fundamentally. In the demonstration fleet-margin report, six of 24 trucks ran at a loss – and each one’s cause was different. One had too low a rate, another too much empty running, a third fuel, a fourth a single expensive repair.
The overall 2.4 % blended all of this variety into one neutral number. Only the breakdown showed that this is not one common problem, but four different ones that need four different fixes.
4. Why it changes decisions
A number that shows no cause leads to “across-the-board” decisions: cut costs everywhere, renegotiate prices with everyone. Such decisions are expensive and often ineffective, because they treat the symptom, not the cause.
When you see the individual truck and its metrics, the decision becomes targeted: reprice this route, review the routes for that truck, investigate that one repair separately. Less effort, more impact.
5. What your data needs to have
For the number to be breakable, the report has to rest on a detailed level – the individual truck, trip, month – rather than a summed result from the start. In practice this means revenue and costs have to be joined in one model and tied to the same truck.
This is exactly where Power Query helps: it joins data from different systems and keeps it at a detailed level, so the report can group it by any cut. The basics of how that is done are here: how to automate an Excel report with Power Query.
Conclusion
An overall fleet margin answers “how are things generally”, but stays silent on the most important question – “for whom are they good and for whom not”. The same 2.4 % can hide both a uniform state and six trucks eating everyone’s profit. The number becomes useful only when you can break it down to the place where something can be done.
This example is taken from a demonstration fleet-margin report – see how it looks.
Have a fleet but don’t know which truck earns?
Tell me what reports you get from your TMS, fuel cards and accounting – I’ll assess for free what can be joined and what you’d see then that you can’t see now.
Get a free assessmentPower Query cheat sheet: automate your report
The key steps, the 5 common mistakes, and when automating is worth it.
- PDF · 2 pages, practical
- No spam — value only