If you’re not yet familiar with the basics, it’s worth first reading:an introduction to DAX.
What is the filter context?
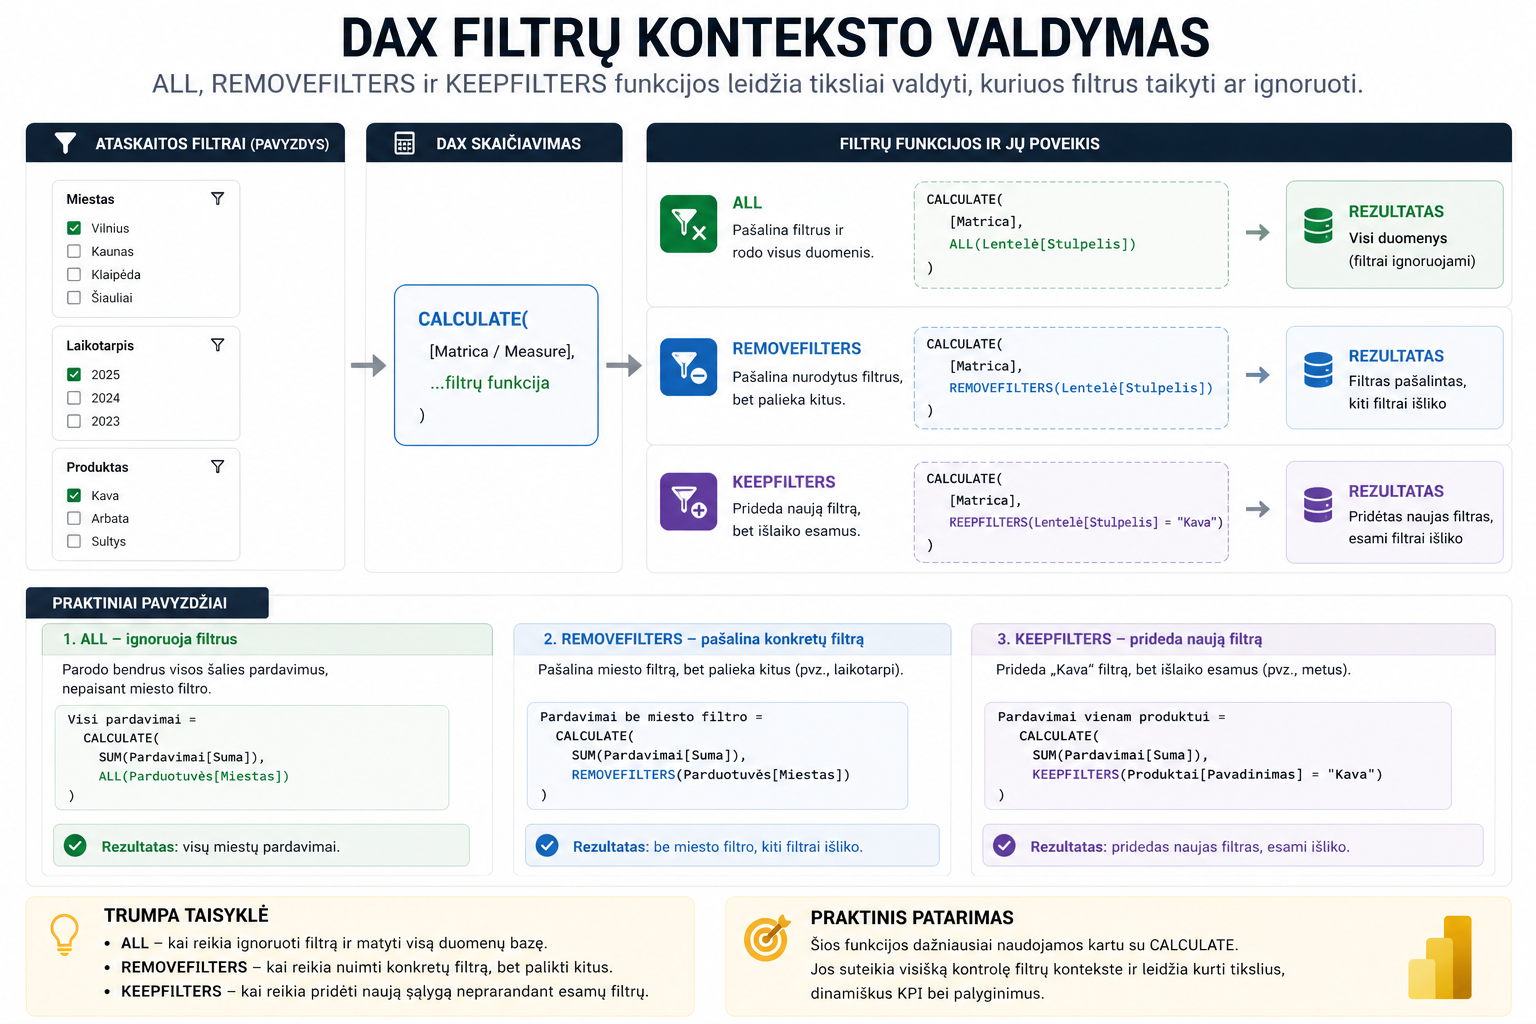
DAX calculations depend on thefilter context. These are all the filters that affect a visual – slicers, tables, page filters.
More on this:a row vs filter context explanation.
ALL – ignores filters
ALLremoves filters and lets you see all the data.
Used when you need an overall result – e.g. for comparing a KPI against whole-market data.
Often used together with:KPI calculations.
REMOVEFILTERS – removes a specific filter
REMOVEFILTERSremoves only the specified filter, but leaves the others.
The difference from ALL – other filters (e.g. date or product) remain.
Very useful when working with:Time Intelligence.
KEEPFILTERS – adds a filter
KEEPFILTERSadds a new filter, but doesn’t remove the existing ones.
This lets you narrow the analysis without losing the already selected filters.
When to use which?
- ALL– when you need to ignore filters and see the whole database
- REMOVEFILTERS– when you need to remove one filter
- KEEPFILTERS– when you need to add a new filter
What to read next
Conclusion
ALL, REMOVEFILTERS and KEEPFILTERS let you precisely control which data participates in a DAX calculation. ALL ignores filters completely, REMOVEFILTERS removes only the selected filter, and KEEPFILTERS adds a new filter without losing the existing ones.
Once you understand the differences between these functions, it becomes much easier to build accurate KPIs, comparisons and dynamic Power BI reports.
Power Query cheat sheet: automate your report
The key steps, the 5 common mistakes, and when automating is worth it.
- PDF · 2 pages, practical
- No spam — value only