
A KPI, orKey Performance Indicator, is a key performance metric. It helps you quickly understand whether an organization is moving in the right direction: whether a sales target has been reached, whether revenue is growing, and whether the result is improving compared to the previous period.
In the Power BI environment, KPIs are most often built usingDAX measures. This means the metrics can change depending on the selected filters, period or visualization context.
If you’re just starting with DAX, it’s worth first reading:an introduction to DAX and the basic Power BI calculation principles.
What a KPI is in the Power BI environment
In a Power BI report, a KPI usually answers one specific question: is the result good, bad or close to the target?
A good KPI should be:
- clear;
- tied to a business goal;
- easy to interpret;
- calculated from reliable data;
- shown in the right context.
For example, a KPI could be the achievement of a sales target, the profit margin, the growth in the number of customers, or the number of orders in a selected period.
KPI logic: actual, target and achievement
A KPI is usually based on three parts:
- Actual– the actual result;
- Target– the plan or goal;
- Achievement– the percentage achieved.
A KPI is always based on comparing actual results with targets.
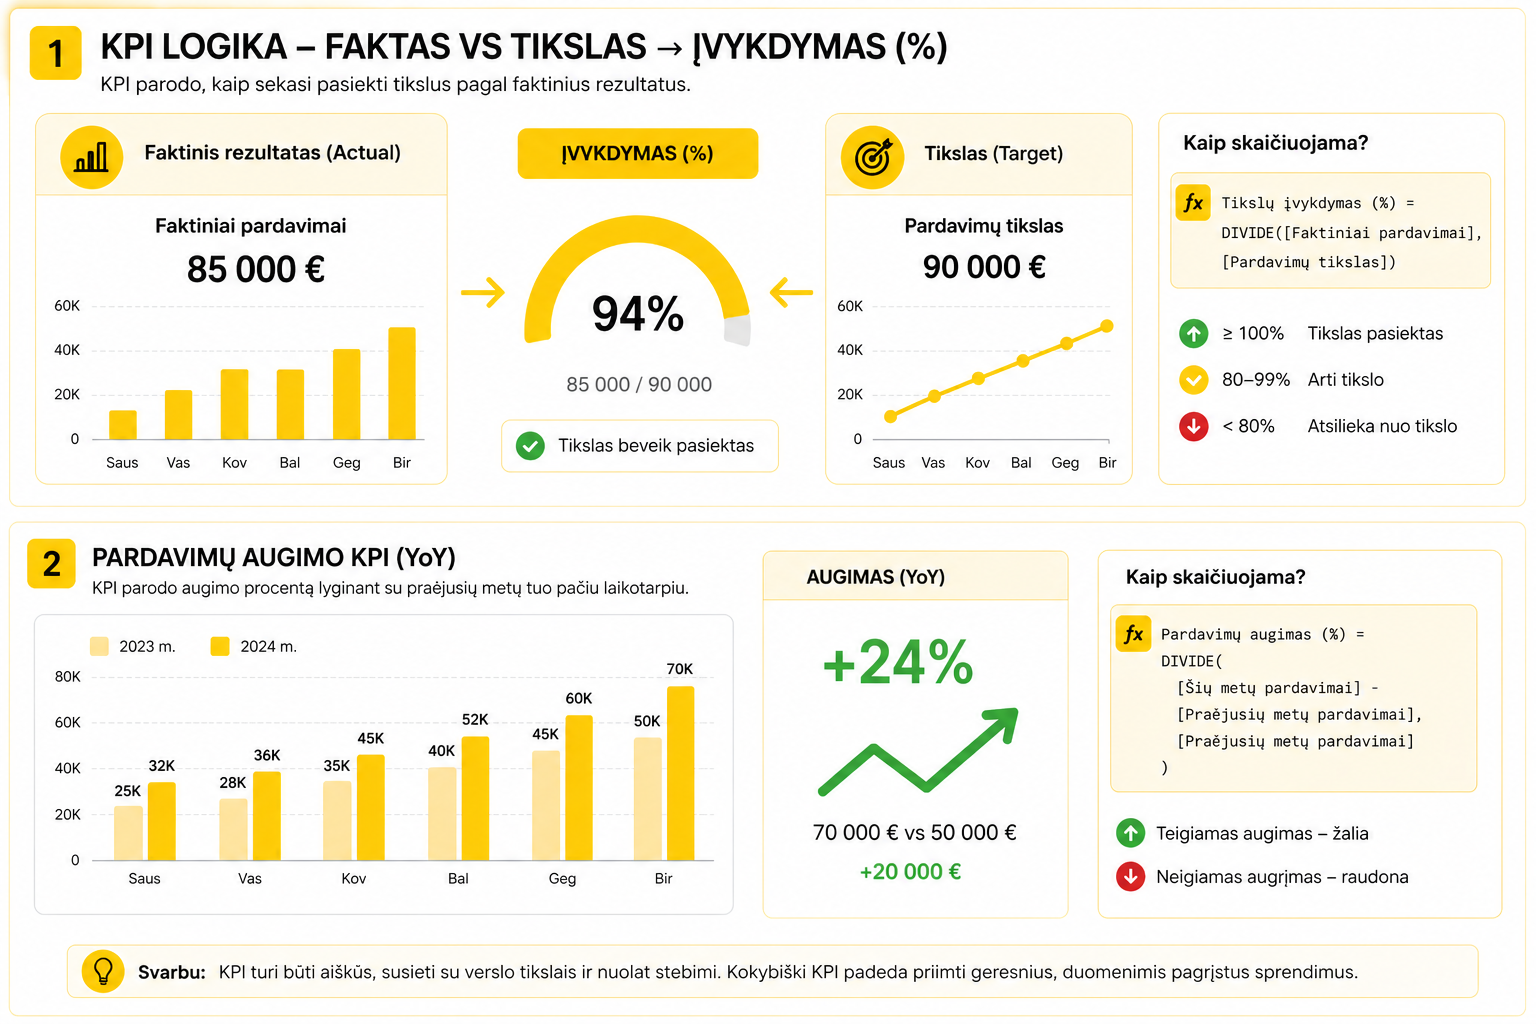
This logic is simple but very useful. Instead of looking at just one number, we can immediately see whether that number is good enough.
A KPI example with DAX
Suppose we have two measures: actual sales and the sales target. In that case, the target achievement percentage can be calculated like this:
Target achievement (%) :=
DIVIDE(
    [Actual sales],
    [Sales target]
)
If the result is1, it means 100%. If the result is greater than 1, the target is exceeded. If it’s less than 1 – the target hasn’t been reached yet.
A sales growth KPI
Another common KPI is growth compared to the previous period. For example, we can compare this year’s sales with last year’s sales.
Sales growth (%) :=
DIVIDE(
    [This year's sales] - [Last year's sales],
    [Last year's sales]
)
Comparing with the previous year lets you quickly assess growth or decline.
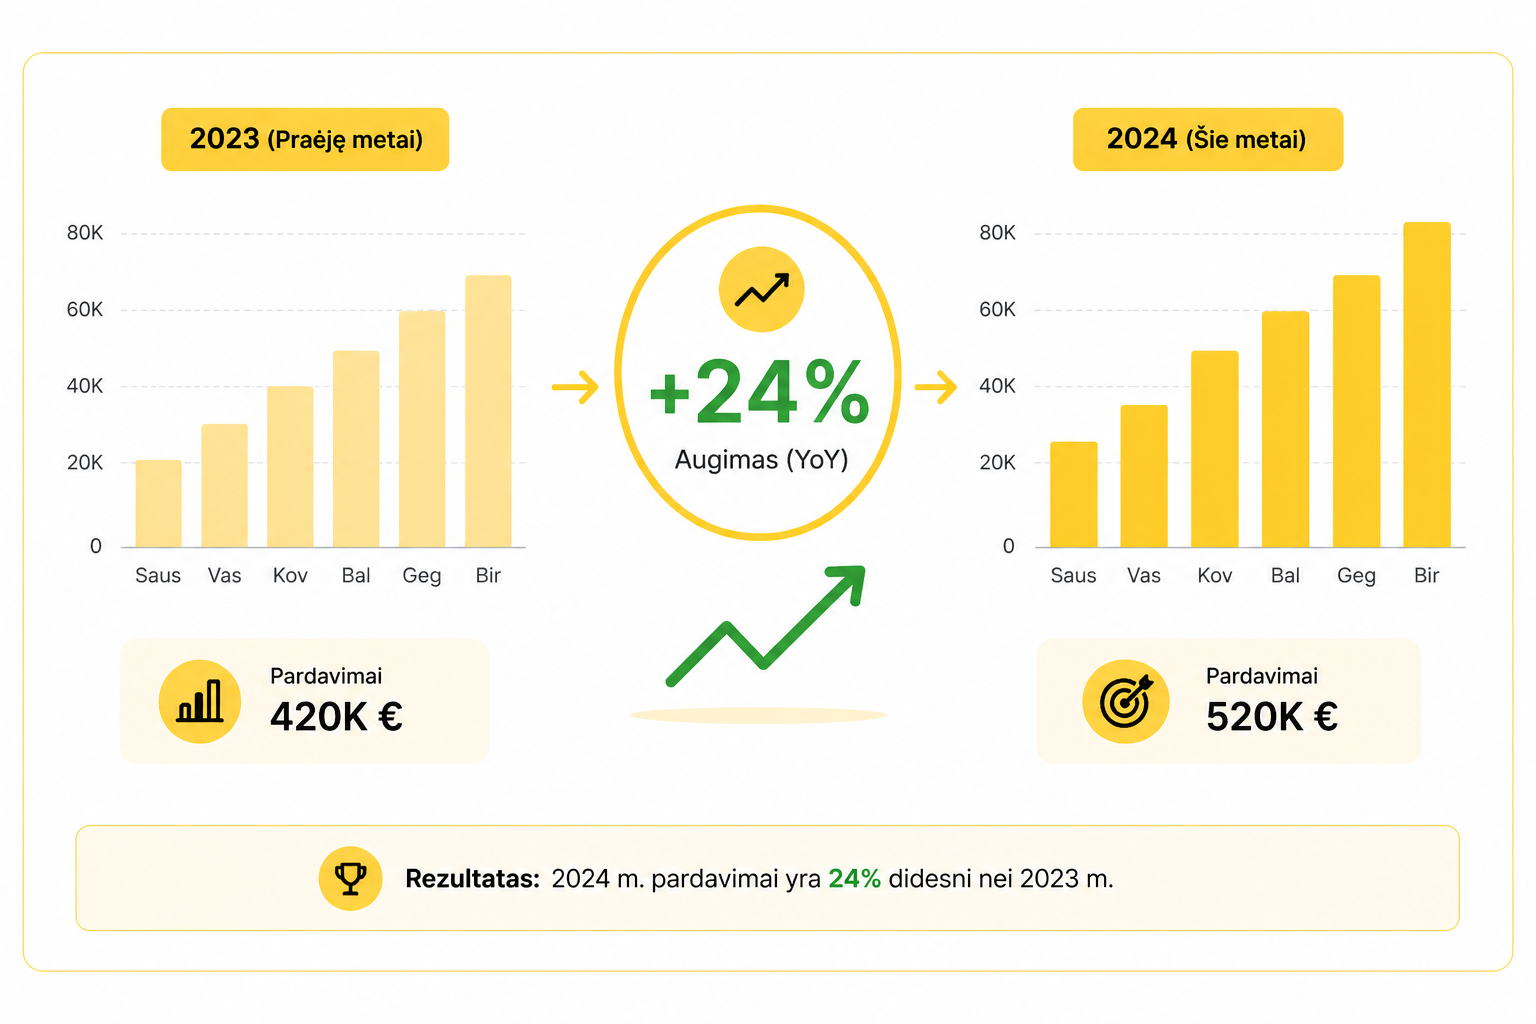
For such comparisons, Time Intelligence functions are often used. More on them:how DAX understands time and how Time Intelligence works in Power BI.
Why a KPI depends on the filter context
A KPI in Power BI always depends on the filter context. The same KPI can show a different result depending on the selected period, product, customer or region.
For example, target achievement might be 94% for the whole company, but 120% for one region and 75% for another. This isn’t an error – that’s how DAX context works.
If you want to better understand this logic, it’s worth reading:how DAX sees data: Row vs Filter context.
In more complex KPIs you sometimes need to control filters with functions like ALL, REMOVEFILTERS or KEEPFILTERS. More on this:how DAX controls the filter context.
Common KPI mistakes
KPIs often look simple, but mistakes in them can heavily distort the analysis.
- calculated columns are used instead of measures;
- it’s unclear which period the KPI applies to;
- there’s no clear target or target value;
- division by zero is handled incorrectly;
- the metric doesn’t adapt to the filters;
- too many KPIs in one report.
Why KPIs matter
KPIs turn a Power BI report from a simple view of data into a decision-making tool.
They let you quickly answer:
- did we reach the target?
- is the result improving?
- where are we falling behind?
- where does more attention need to go?
Good KPIs help you not only see the numbers, but also understand what to do with them.
What to read next
Conclusion
KPIs in the Power BI environment are most often built using DAX measures. They let you compare actual results with targets, calculate the achievement percentage and assess growth over time.
The most important thing to understand is that a KPI is not just a pretty card in a report. It’s a business metric that must be clearly defined, correctly calculated and shown in the right context.
If KPIs are built correctly, a Power BI report becomes much clearer, more practical and more useful for making decisions.
Power Query cheat sheet: automate your report
The key steps, the 5 common mistakes, and when automating is worth it.
- PDF · 2 pages, practical
- No spam — value only