
Time analysis is one of the most common topics in Power BI reports. In almost every analysis we want to know how we did this month, how the result looks from the start of the year, or how this period compares with the previous year.
To solve such questions, DAX has specialTime Intelligencefunctions. They let you work with periods much more conveniently than manually filtering dates.
If you’re just starting to learn DAX, it’s worth first reading:an introduction to DAX and the basic Power BI calculation principles.
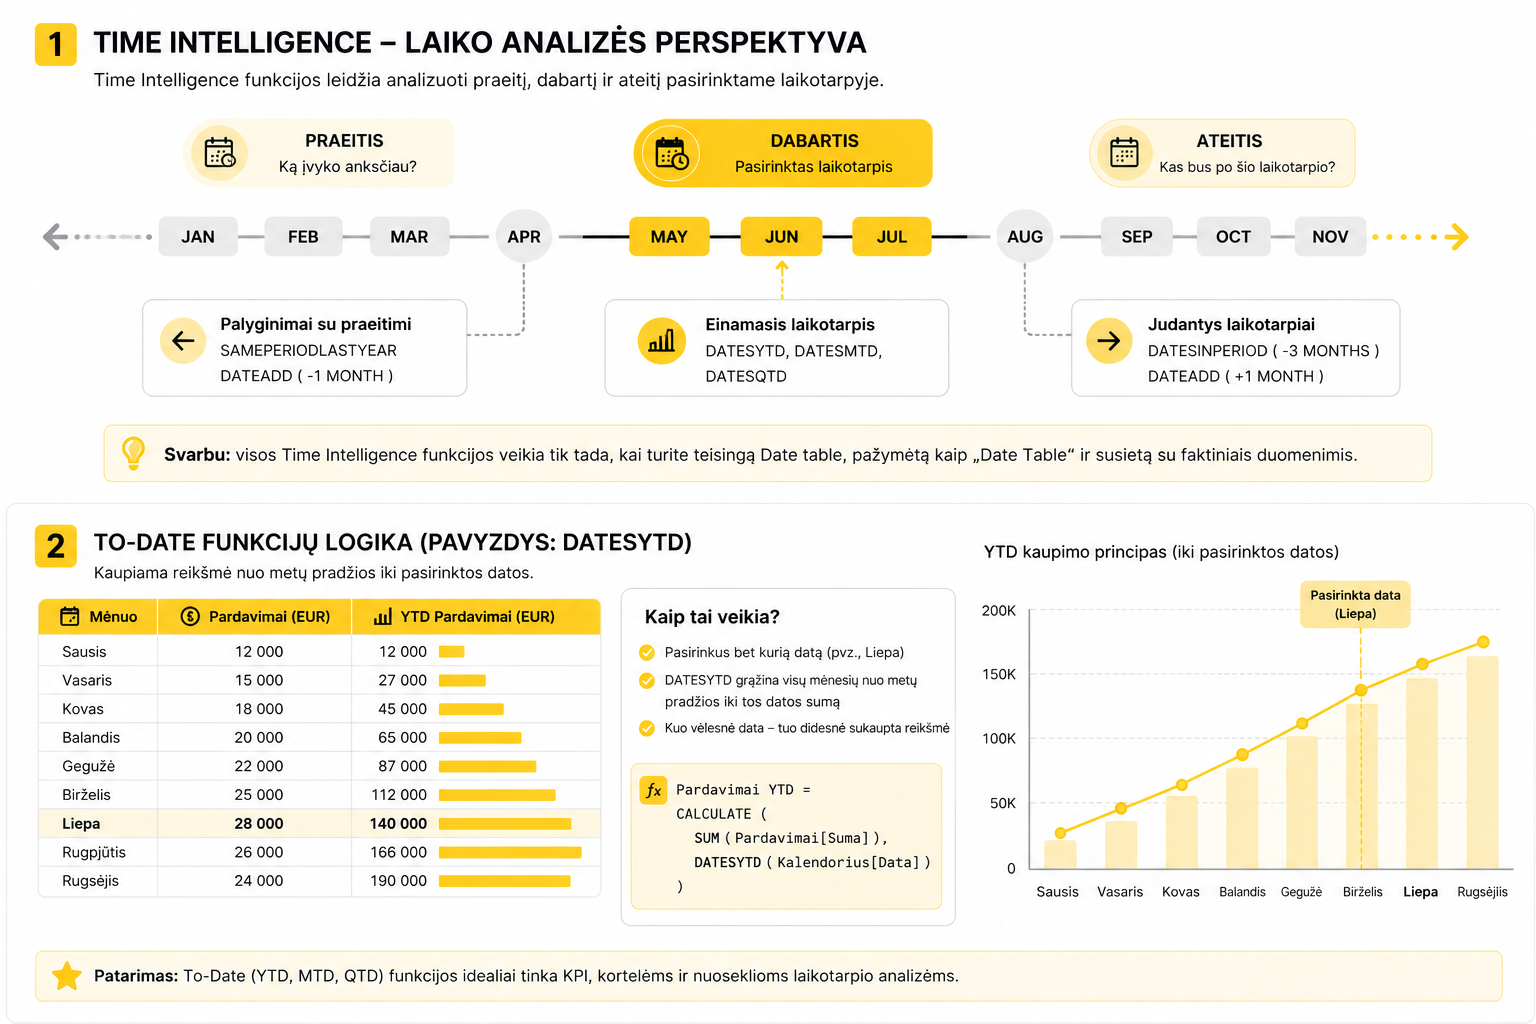
What is Time Intelligence?
Time Intelligence– is a group of DAX functions for time analysis. They let you calculate results by period: from the start of the year, over the previous period, over the last few months, and so on.
For example, with Time Intelligence you can answer questions like:
- what are the sales from the start of the year?
- how much did we sell in the same period last year?
- what does the result of the last 3 months look like?
- is this month better than the previous one?
Why a Date table is essential
Time Intelligence functions only work when the model has a correctly built calendar table –a Date table.
Such a table must have:
- one date column with no gaps in the date sequence;
- unique dates;
- a relationship with the fact data table;
- a correctly set date type;
- a marking as aDate Tablein the Power BI model.
If the Date table is messy or not linked to the fact table, Time Intelligence formulas can return wrong results or not work as you expect.
Period totals: YTD, MTD, QTD
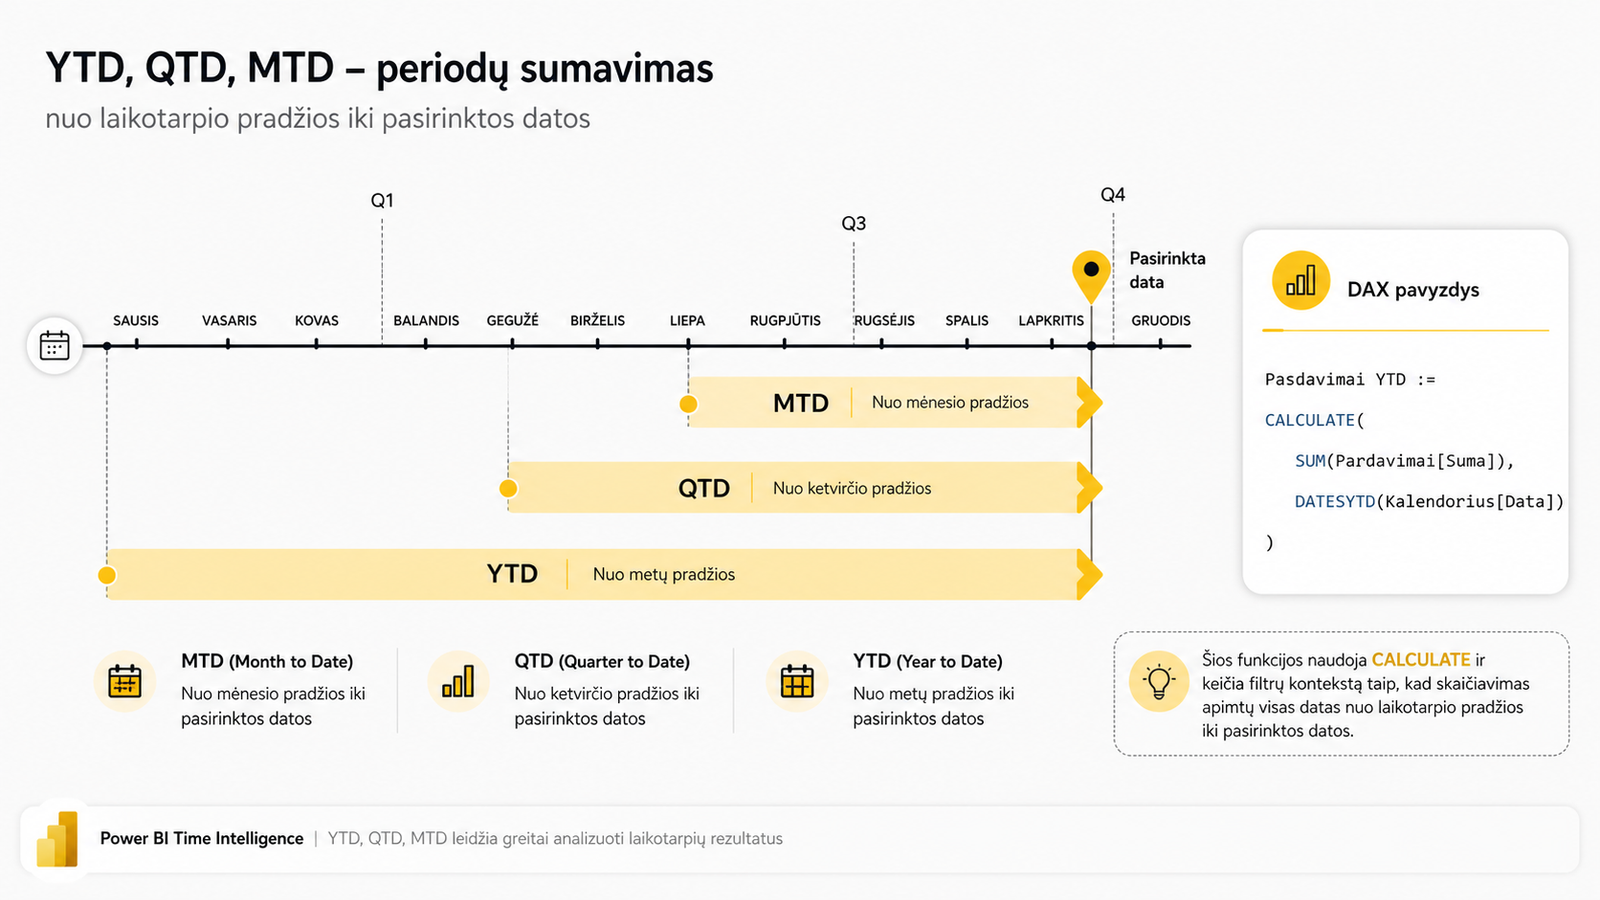
Some of the most common Time Intelligence functions are those that sum a result from the start of a period up to the selected date.
- DATESYTD– calculates from the start of the year;
- DATESMTD– calculates from the start of the month;
- DATESQTD– calculates from the start of the quarter.
For example, a sales-from-the-start-of-the-year formula might look like this:
Sales YTD :=
CALCULATE(
    SUM(Sales[Amount]),
    DATESYTD(Calendar[Date])
)
In this caseCALCULATEchanges the filter context so that the calculation covers all dates from the start of the year to the selected date.
If you want to better understand why this works exactly this way, it’s worth reading:how DAX sees data: Row vs Filter context.
Comparisons with previous periods
Another common Time Intelligence task is comparing the current period with a previous one.
For this, these functions are often used:
- SAMEPERIODLASTYEAR– returns the same period in the previous year;
- DATEADD– lets you shift dates by a specified interval;
- PARALLELPERIOD– returns a similar period in an earlier or later period.
For example, a last-year sales formula:
Sales last year :=
CALCULATE(
    SUM(Sales[Amount]),
    SAMEPERIODLASTYEAR(Calendar[Date])
)
Such a formula lets you compare this year’s results with last year’s results in the same period.
Moving periods
Sometimes we want to look not at calendar years or months, but at a moving period, for example the last 3 months.
For this, the function often used isDATESINPERIOD.
Sales 3 months :=
CALCULATE(
    SUM(Sales[Amount]),
    DATESINPERIOD(
        Calendar[Date],
        MAX(Calendar[Date]),
        -3,
        MONTH
    )
)
This formula calculates sales over the last 3 months from the selected date.
Since such calculations depend on the filter context, you sometimes need to better understand how DAX controls filters. More on this:the logic of the ALL, REMOVEFILTERS and KEEPFILTERS functions.
Common mistakes
Time Intelligence formulas often fail not because of the formula itself, but because of the model structure.
- there’s no Date table in the model;
- the Date table isn’t marked as aDate Table;
- dates are stored as text;
- the calendar table is missing dates;
- there’s no relationship between the Date table and the fact table;
- the wrong date column is used in the formula.
Where to use it in practice?
Time Intelligence is most often used in KPI cards, trend charts, monthly comparisons and management reports.
For example, you can calculate:
- sales from the start of the year;
- the change compared with the previous year;
- the average of the last 3 months;
- the current month’s result;
- the percentage growth over time.
If you’re building KPIs in a Power BI report, this article will also be useful:how to build and calculate KPIs with DAX.
What to read next
Conclusion
Time Intelligence functions let you perform time analysis in Power BI reports: calculate YTD, compare with the previous year, analyze moving periods and see trends.
But the most important thing to understand is that these functions only work when the model has a tidy Date table, correct relationships and dates stored in the right format.
Once this foundation is in place, Time Intelligence becomes one of the most powerful DAX tools in Power BI analysis.
Power Query cheat sheet: automate your report
The key steps, the 5 common mistakes, and when automating is worth it.
- PDF · 2 pages, practical
- No spam — value only