

When a report shows that a truck runs at a loss, that is not yet an answer – it is only the start of the question. “Loss-making” changes nothing until you know why. And the cause almost always hides in three metrics: empty running, fuel cost and repairs.
These three numbers explain most loss-making trucks – and, crucially, each one leads to a different fix.
1. “Loss-making” is not yet a cause
A loss-making truck is easy to spot – harder to explain. Two trucks with the same negative margin can be loss-making for completely different reasons: one drives too much empty, another burns fuel, a third fell into one expensive repair.
So before changing anything, you have to isolate the cause. The three metrics below do that best, because each points to a different source of loss.
2. Empty running: every fifth kilometre without a load
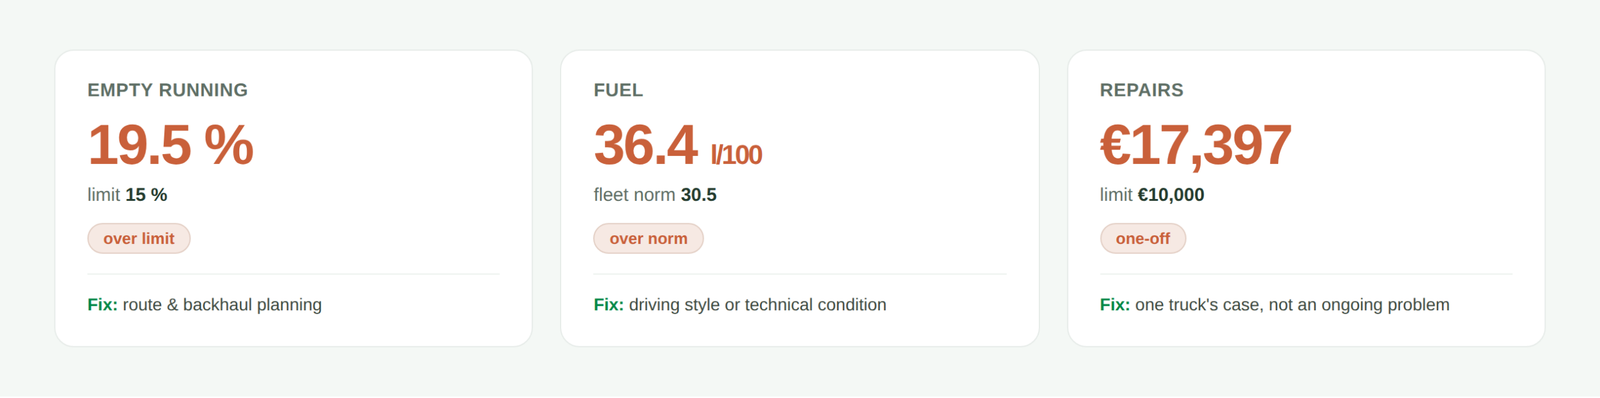
Empty running is the kilometres driven without a load. They cost fuel and time but earn nothing. In the demonstration report the worst truck’s empty running reached 19.5 % – meaning roughly every fifth kilometre was loss-making before counting any other cost.
High empty running is almost always a matter of route and backhaul planning, not the driver. So the fix, too, is at the dispatcher’s level.
3. Fuel norm: compare with the fleet, not a hunch
Fuel cost is best judged not in absolute litres, but in litres per 100 kilometres, compared against a fleet norm. But the norm has to be calibrated against the fleet itself, not pulled from the air.
A real example: if you set the limit at 33 l/100 km while the fleet average is 32.1, nearly half the trucks light up red – and the threshold marks not a problem but the average. So the limit is raised to a genuinely standout level (35 in the example), leaving only the trucks that really fall out of the pack.
4. Repairs: one event flips an average truck
Repair costs are uneven: ten trucks can stay on the norm for years while one falls into a single expensive breakdown and becomes loss-making with a single entry. In the demonstration report one €17,397 repair turned a previously average truck loss-making.
It is important to recognise such a case as one-off, not as an ongoing problem. Otherwise you risk “treating” a truck that is actually fine – it just had one expensive month.
5. How to turn the deviation into euros
Percentages and litres persuade less than euros. So it’s worth converting the fuel deviation from the norm into money: deviation in litres × average refuel price = exactly what that excess costs over the period.
This “fuel overspend in euros” immediately shows which trucks deserve attention first – not the ones with the biggest deviation in percent, but the ones where it turns into the biggest sum. You can see how such metrics come together in one model here: the fleet-margin report case study.
Conclusion
“A loss-making truck” is a diagnosis without a cause. Empty running, fuel against the norm and repairs name that cause – and point to different fixes: routes, driving, or one truck’s economics. And there is one crucial condition: thresholds must be calibrated to your fleet, not to a hunch.
Want to see which truck is loss-making, and why?
Tell me what data you have from your TMS, fuel cards and accounting – I’ll assess for free which metrics can be brought into one report and what it will show.
Get a free assessmentPower Query cheat sheet: automate your report
The key steps, the 5 common mistakes, and when automating is worth it.
- PDF · 2 pages, practical
- No spam — value only