Power BI analysis happens in three stages:Power Query → Data model → DAX.
The data is first tidied up withPower Query, then connected in the model, and only after that used for calculations.
What a data model is
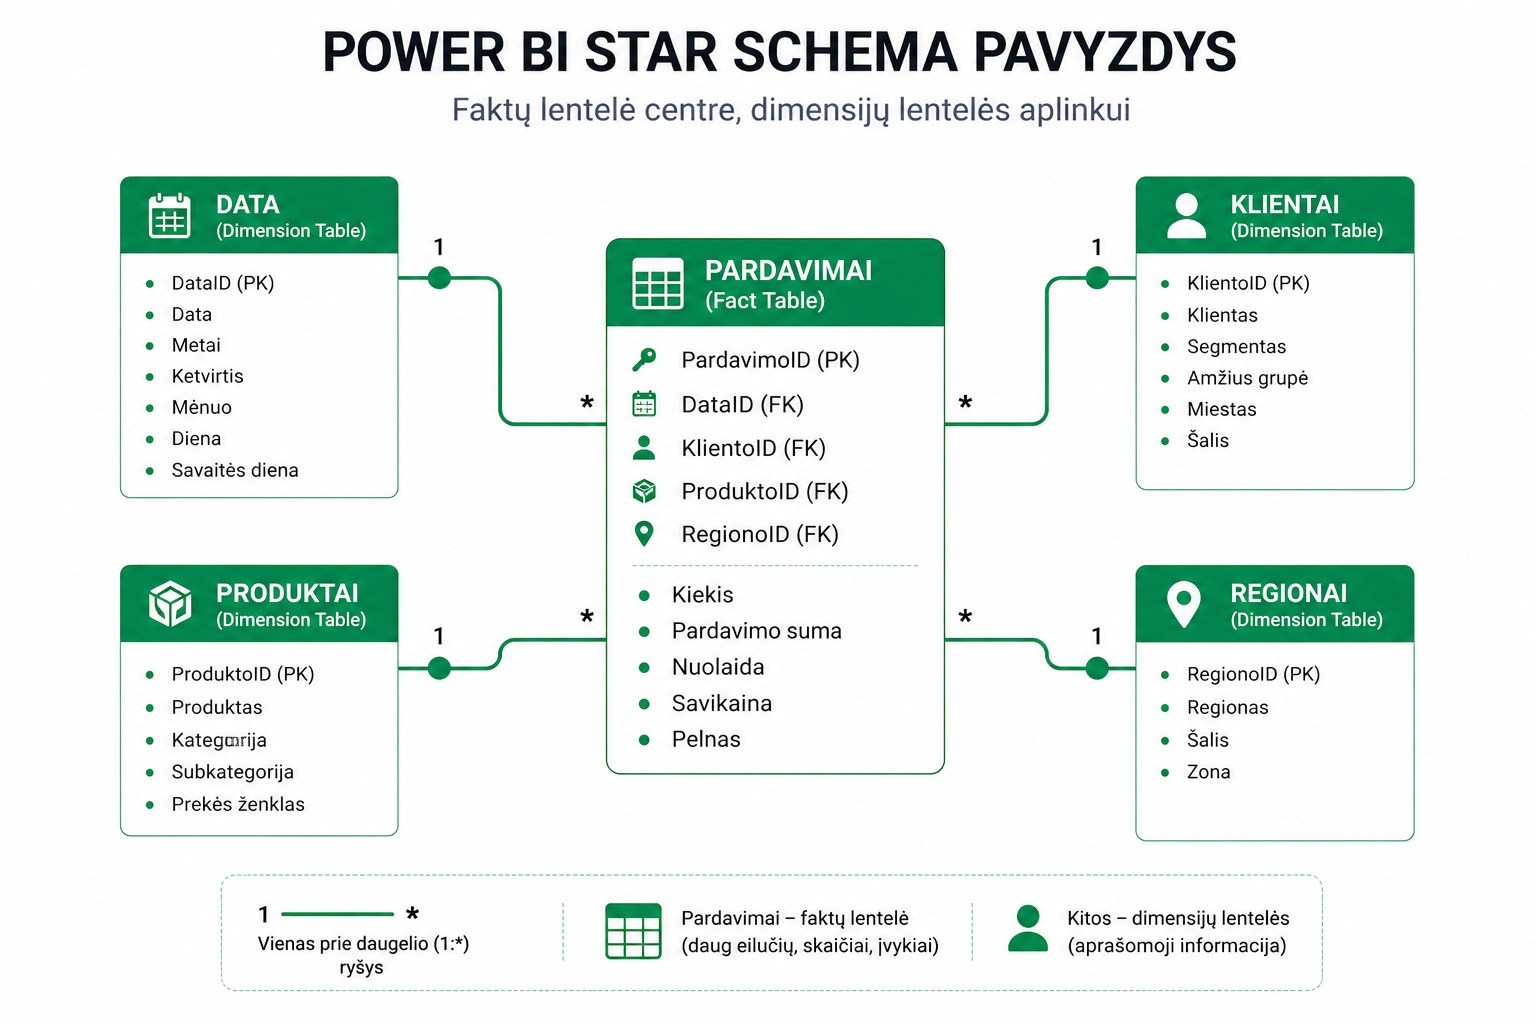
A data model– is the structure of tables and their relationships in the Power BI environment.
- Fact tables– numbers (sales, transactions)
- Dimension tables– descriptive information (products, customers, date)
The most commonly used structure is theStar schema, because it lets you build fast and clear models.
Relationship types
- 1:* (one-to-many)– the most common and recommended
- *:* (many-to-many)– use with caution
- 1:1– a rare case
Incorrectly chosen relationships can cause wrong results in reports.
Filter direction
- Single– filters travel in one direction (recommended)
- Both– filters travel in both directions (use with caution)
The filter direction directly affects how DAX calculates. More on this:row and filter context.
Best practices
- usethe Star schema
- avoidmany-to-manyrelationships
- usesingle-direction filtering
- fewer tables = a better model
- havea calendar table
A calendar table is essential if you plan to useTime Intelligence.
Why the model matters
Even if the data is tidy at the Power Query stage, a bad model can ruin the whole analysis.
A correct model lets you:
- calculate DAX formulas accurately
- build clear visualizations
- avoid double counting
DAX formulas always rely on the model, so it’s worth starting with:an introduction to DAX.
What to read next
Conclusion
The data model is the foundation of Power BI. It decides how the data “talks” to each other.
Once you understand the relationships and structure, it becomes much easier to build accurate and reliable reports.
Power Query cheat sheet: automate your report
The key steps, the 5 common mistakes, and when automating is worth it.
- PDF · 2 pages, practical
- No spam — value only