Power BIlets you collect, process and visualize data in one place. If you work with Excel, moving to Power BI is a natural step – instead of static tables you get interactive reports.
The first real step when working with Power BI is data preparation:what Power Query is.
Why use Power BI
- works with millions of records
- connects to various data sources
- lets you automate data refresh
- builds interactive reports and dashboards
- lets you share insights with your team
Power BI uses efficient data storage and modeling, so it can process much larger volumes of data than ordinary Excel tables.
Another important aspect is thedata model. For the analysis to be correct, you need to understand how tables are related:the Power BI data model and relationships.
In Power BI models, the goal is usually a clear structure, such as aStar schema, because it helps build faster and clearer reports.
Where Power BI is used
Power BI is used almost everywhere data analysis is needed:
- in finance
- in sales
- in marketing
- in logistics
- in project management
- in the public sector
The Power BI ecosystem
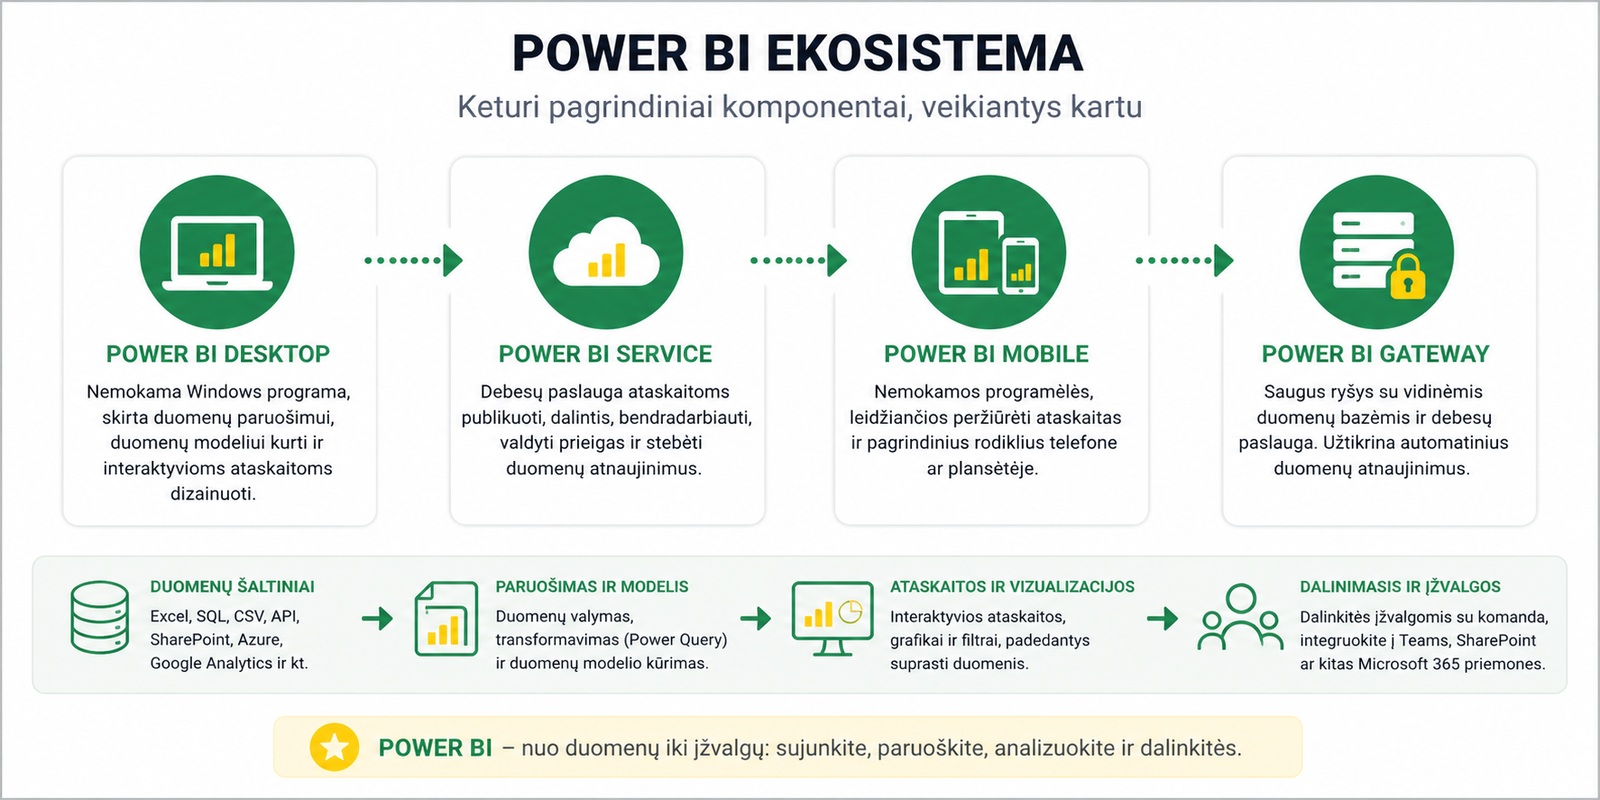
Power BI consists of several main components that work together:
- Power BI Desktop– building reports, the data model and visualizations.
- Power BI Service– publishing reports, sharing and managing access.
- Power BI Mobile– viewing reports on a phone or tablet.
- Power BI Gateway– a secure connection to internal data sources and automatic refreshes.
How to get started with Power BI
- install Power BI Desktop
- load data via Get Data
- tidy up the data in the Power Query window
- build the data model and relationships between tables
- create visualizations
- use DAX formulas for calculations
- publish the report to Power BI Service
If you haven’t worked with DAX yet, start with:an introduction to DAX.
Later you can move on to more advanced functions, for exampleCALCULATE, which lets you change the filter context.
Continuous updates
Power BI is constantly being improved – every month new features, visualizations and enhancements appear.
You can publish finished reports, share them with your team or embed them in a website:how to embed an interactive Power BI chart on a website.
What to read next
Conclusion
Power BI is one of the most powerful tools for data analysis. It helps you collect data, prepare it, connect it, visualize it and share insights.
To start, the most important thing is to understand three things: data preparation with Power Query, the data model and DAX calculations.
Power Query cheat sheet: automate your report
The key steps, the 5 common mistakes, and when automating is worth it.
- PDF · 2 pages, practical
- No spam — value only