
The scenario is familiar: last month the report worked perfectly. This month you downloaded a new file, pasted the data – and suddenly half the table shows #REF!, the totals don’t match, and the chart is empty. You spend the evening patching something that worked just yesterday.
The problem is almost never that „Excel is bad”. The problem is that the report was built to work once, not to survive change. The good news: reliability can be planned in advance, and it doesn’t require anything complicated.
1. Separate the three layers: data, calculations, presentation
The most common cause of breakage is when everything is mixed on one sheet: raw data, formulas and a pretty dashboard stacked on top of each other. Change one, and another collapses.
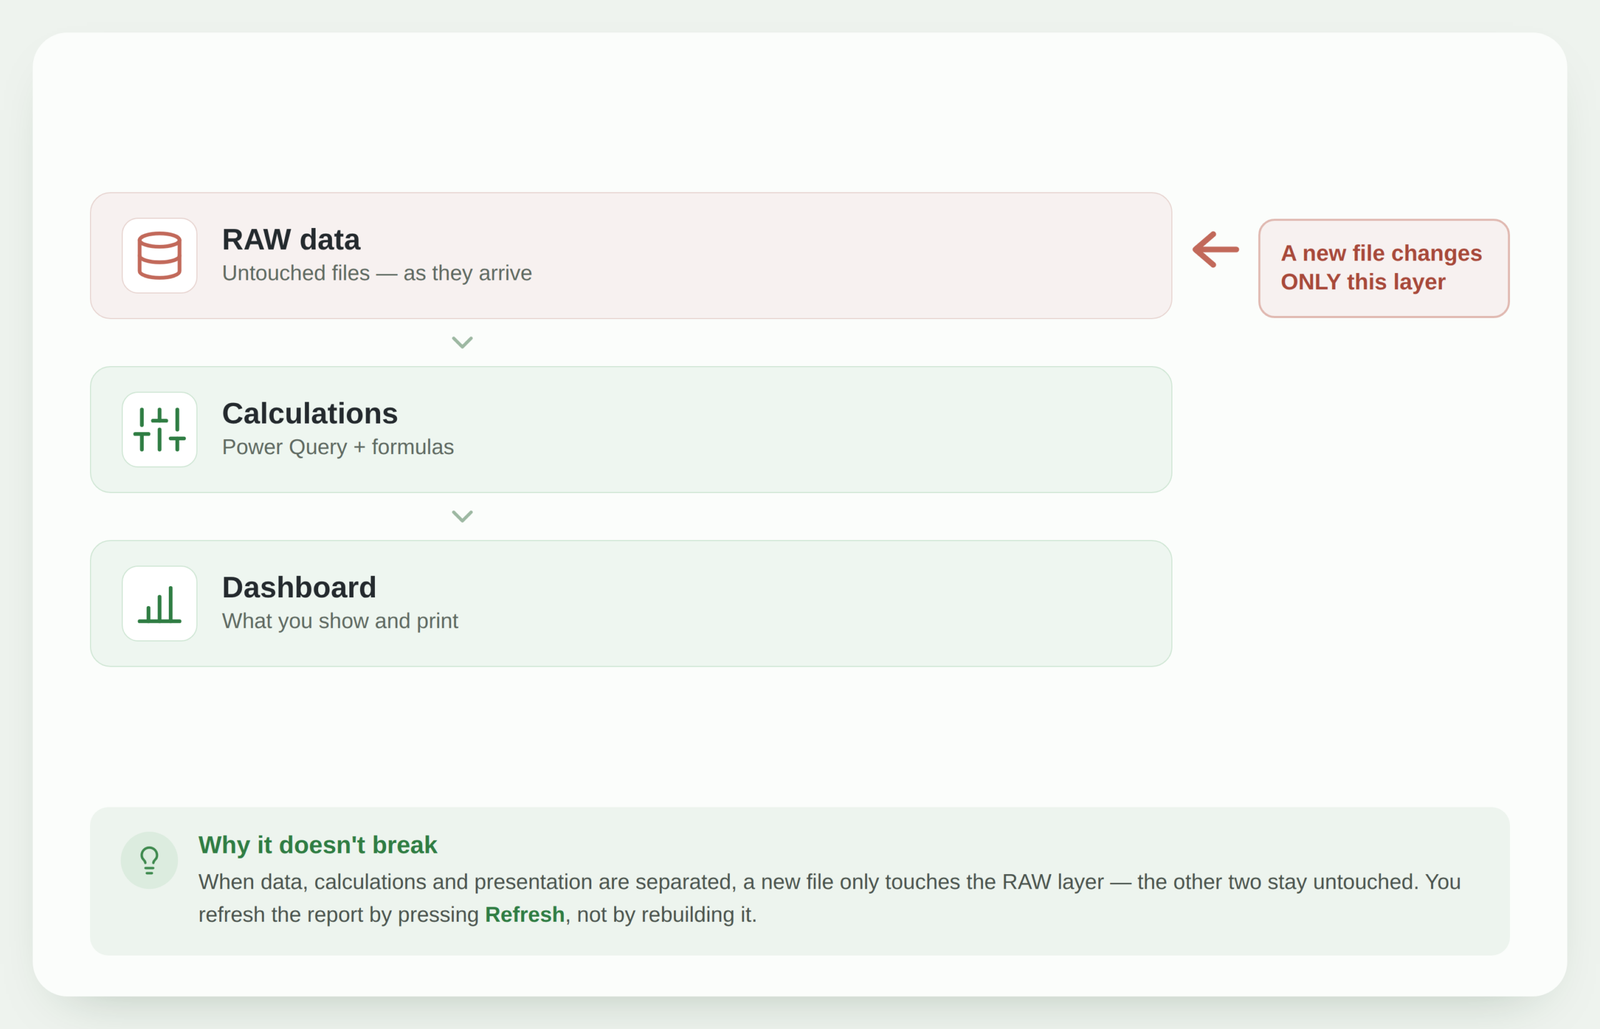
Plan the report as three separate layers: RAW – untouched raw data; calculations – where you clean and combine it; presentation – the dashboard you show. When a new file changes only the RAW layer and the other two stay untouched, the report stops breaking.
2. Bring data in via Power Query, not manual copy-paste
Manual „copy/paste” into the report is one of the most common sources of breakage: one row too many, a different column order – and everything shifts.
Instead, let the data arrive through Power Query. You record how to take and clean it once, and next month you just press Refresh. The data always lands in the same place in the same shape – no manual pasting and no accidental shifts.
3. Use Excel Tables, not fixed ranges
If your formulas rely on a fixed range (e.g. A2:D100), adding new rows leaves part of the data outside the range – the report „works”, but the numbers are wrong. This is one of the most treacherous breakages, because the error is invisible.
Converting your data into an Excel Table (Ctrl+T) gives you structured references: the table grows and shrinks by itself, and formulas and PivotTables automatically include new rows. One of the simplest steps that instantly increases reliability.
4. Rely on column names, not cell positions
„The fourth column” is a fragile reference: when a new column is inserted in the source, the fourth now means something else. That’s exactly how silent errors and #REF! appear.
Both Power Query steps and formulas (e.g. XLOOKUP by column name) should rely on names, not positions. Then reordering the source no longer breaks the logic – all that matters is that a column with that name exists.
5. One input point and no hard-coded values
When the file path, the month or a filter are buried deep inside formulas or queries in several places, every change turns into a hunt across the whole report – and you almost always miss one spot.
Put all the variables – the folder path, the date, the parameters – in one clear place (e.g. a separate „Settings” table) that everything else points to. When the month changes, you change one cell, not ten.
What to do next?
You don’t have to redo everything at once. Pick the one report that breaks most often and apply at least the first three principles – separate layers, Power Query and Tables. That’s usually enough to turn next month’s update into a few-minute Refresh.
If you want to see the whole path from raw files to a clean dashboard, here’s how to automate an Excel report using Power Query, and a real project example shows how the same principles apply in an actual report.
Conclusion
A report that „breaks after a month” is almost always the result of a poorly thought-out structure, not of bad Excel. Separate layers, Power Query, Tables, references by name and a single input point – five principles that turn a report from fragile into one that simply refreshes. Plan it once – and stop rescuing it every month.
Want a report that doesn’t break?
If you have a report you patch up every month, I can review its structure and rebuild it so it refreshes on its own – using Excel, Power Query or Power BI.
Assess automation optionsPower Query cheat sheet: automate your report
The key steps, the 5 common mistakes, and when automating is worth it.
- PDF · 2 pages, practical
- No spam — value only